Disney Data Dump July 26 2023
I hope you all had a lovely Christmas-in-July and that you’re enjoying the inevitable winding down of another summer. Here’s my secret summer hack – we leave our calendars as empty as possible from the time school gets out until mid-July, and then pack all of everything in during the last month or so of summer. Then the family is so exhausted that school starting up seems like a continuation of all of the fun! And it looks like more families might be taking this tactic, as the super-low crowds of early July haven’t stayed exactly super-low, and have actually climbed a little bit as we head further into summer.
Observed Crowd Levels July 18 – 24

Well, the roller coaster is back – and we even see a crowd level 8 day! Haven’t had one of those in quite a long time. Of course, a lot of that was due to 13% of Hollywood Studios capacity being lost to downtime – resulting in a crowd level 9 day at that park. Boo. Otherwise, the weekend was once again a lovely time to be in Orlando, at least as far as wait times were concerned!

When we get down to a park-by-park level, we can see the roller coaster crowd behavior at every park except Animal Kingdom, which hovered between a 5 and 7 all week long. But even EPCOT got in on the roller coaster game this week, bottoming out at a crowd level 2 on Sunday before hopping all of the way back up to a 7 on Monday. Continue to avoid those Mondays in the parks if you can!
Performance of Crowd Level Predictions
Each week, I’m giving you a very transparent look into how our crowd level predictions performed. Each day at each park is one data point, so this week we have 28 different crowd level predictions to evaluate each week. Any time a prediction is within one or two crowd levels, things won’t really “feel” much different than what we predicted. Being off by 3 or more crowd levels is where we’d like to be more accurate because you might feel that difference in wait times throughout the day.

In the past week, Touring Plans predictions were either spot-on or within 1 crowd level 71% of the time. This better than average, but slightly down from the highs of the past two weeks. 96% of the time Touring Plans predictions were within 2 crowd levels, and that means we earn an A for our predictions this past week! This is great performance. The biggest miss of the week was at Magic Kingdom on July 22nd, when the predicted crowd level was a 6, but we only saw a crowd level 3.
Attraction Downtime July 18 – 24
If we average all of the capacity lost due to unexpected downtime over the past week, it comes out to 5.3% of attractions unexpectedly being down. Quite a bit worse than last week, and worse than our historical average. The park with the biggest issues was Animal Kingdom, with 6.9% of its capacity lost due to unexpected downtime. That’s the same result as last week, and points to continued problems at Animal Kingdom.
The worst day for attraction downtime in the past week was on July 19th. On that day, 7% of all capacity at WDW was lost due to unexpected downtime. The worst park-day of the week was at Hollywood Studios on July 24th. On that park day, a disappointing 13% of the capacity at the park was lost due to unexpected downtime. Hollywood Studios was open for 12.5 hours on the 24th, so 17% downtime is the equivalent of the whole park being down for over 97 minutes. All of that downtime at a park with already-high wait times increased the crowd level all of the way to a 9.
Attraction Downtime Worst Offenders
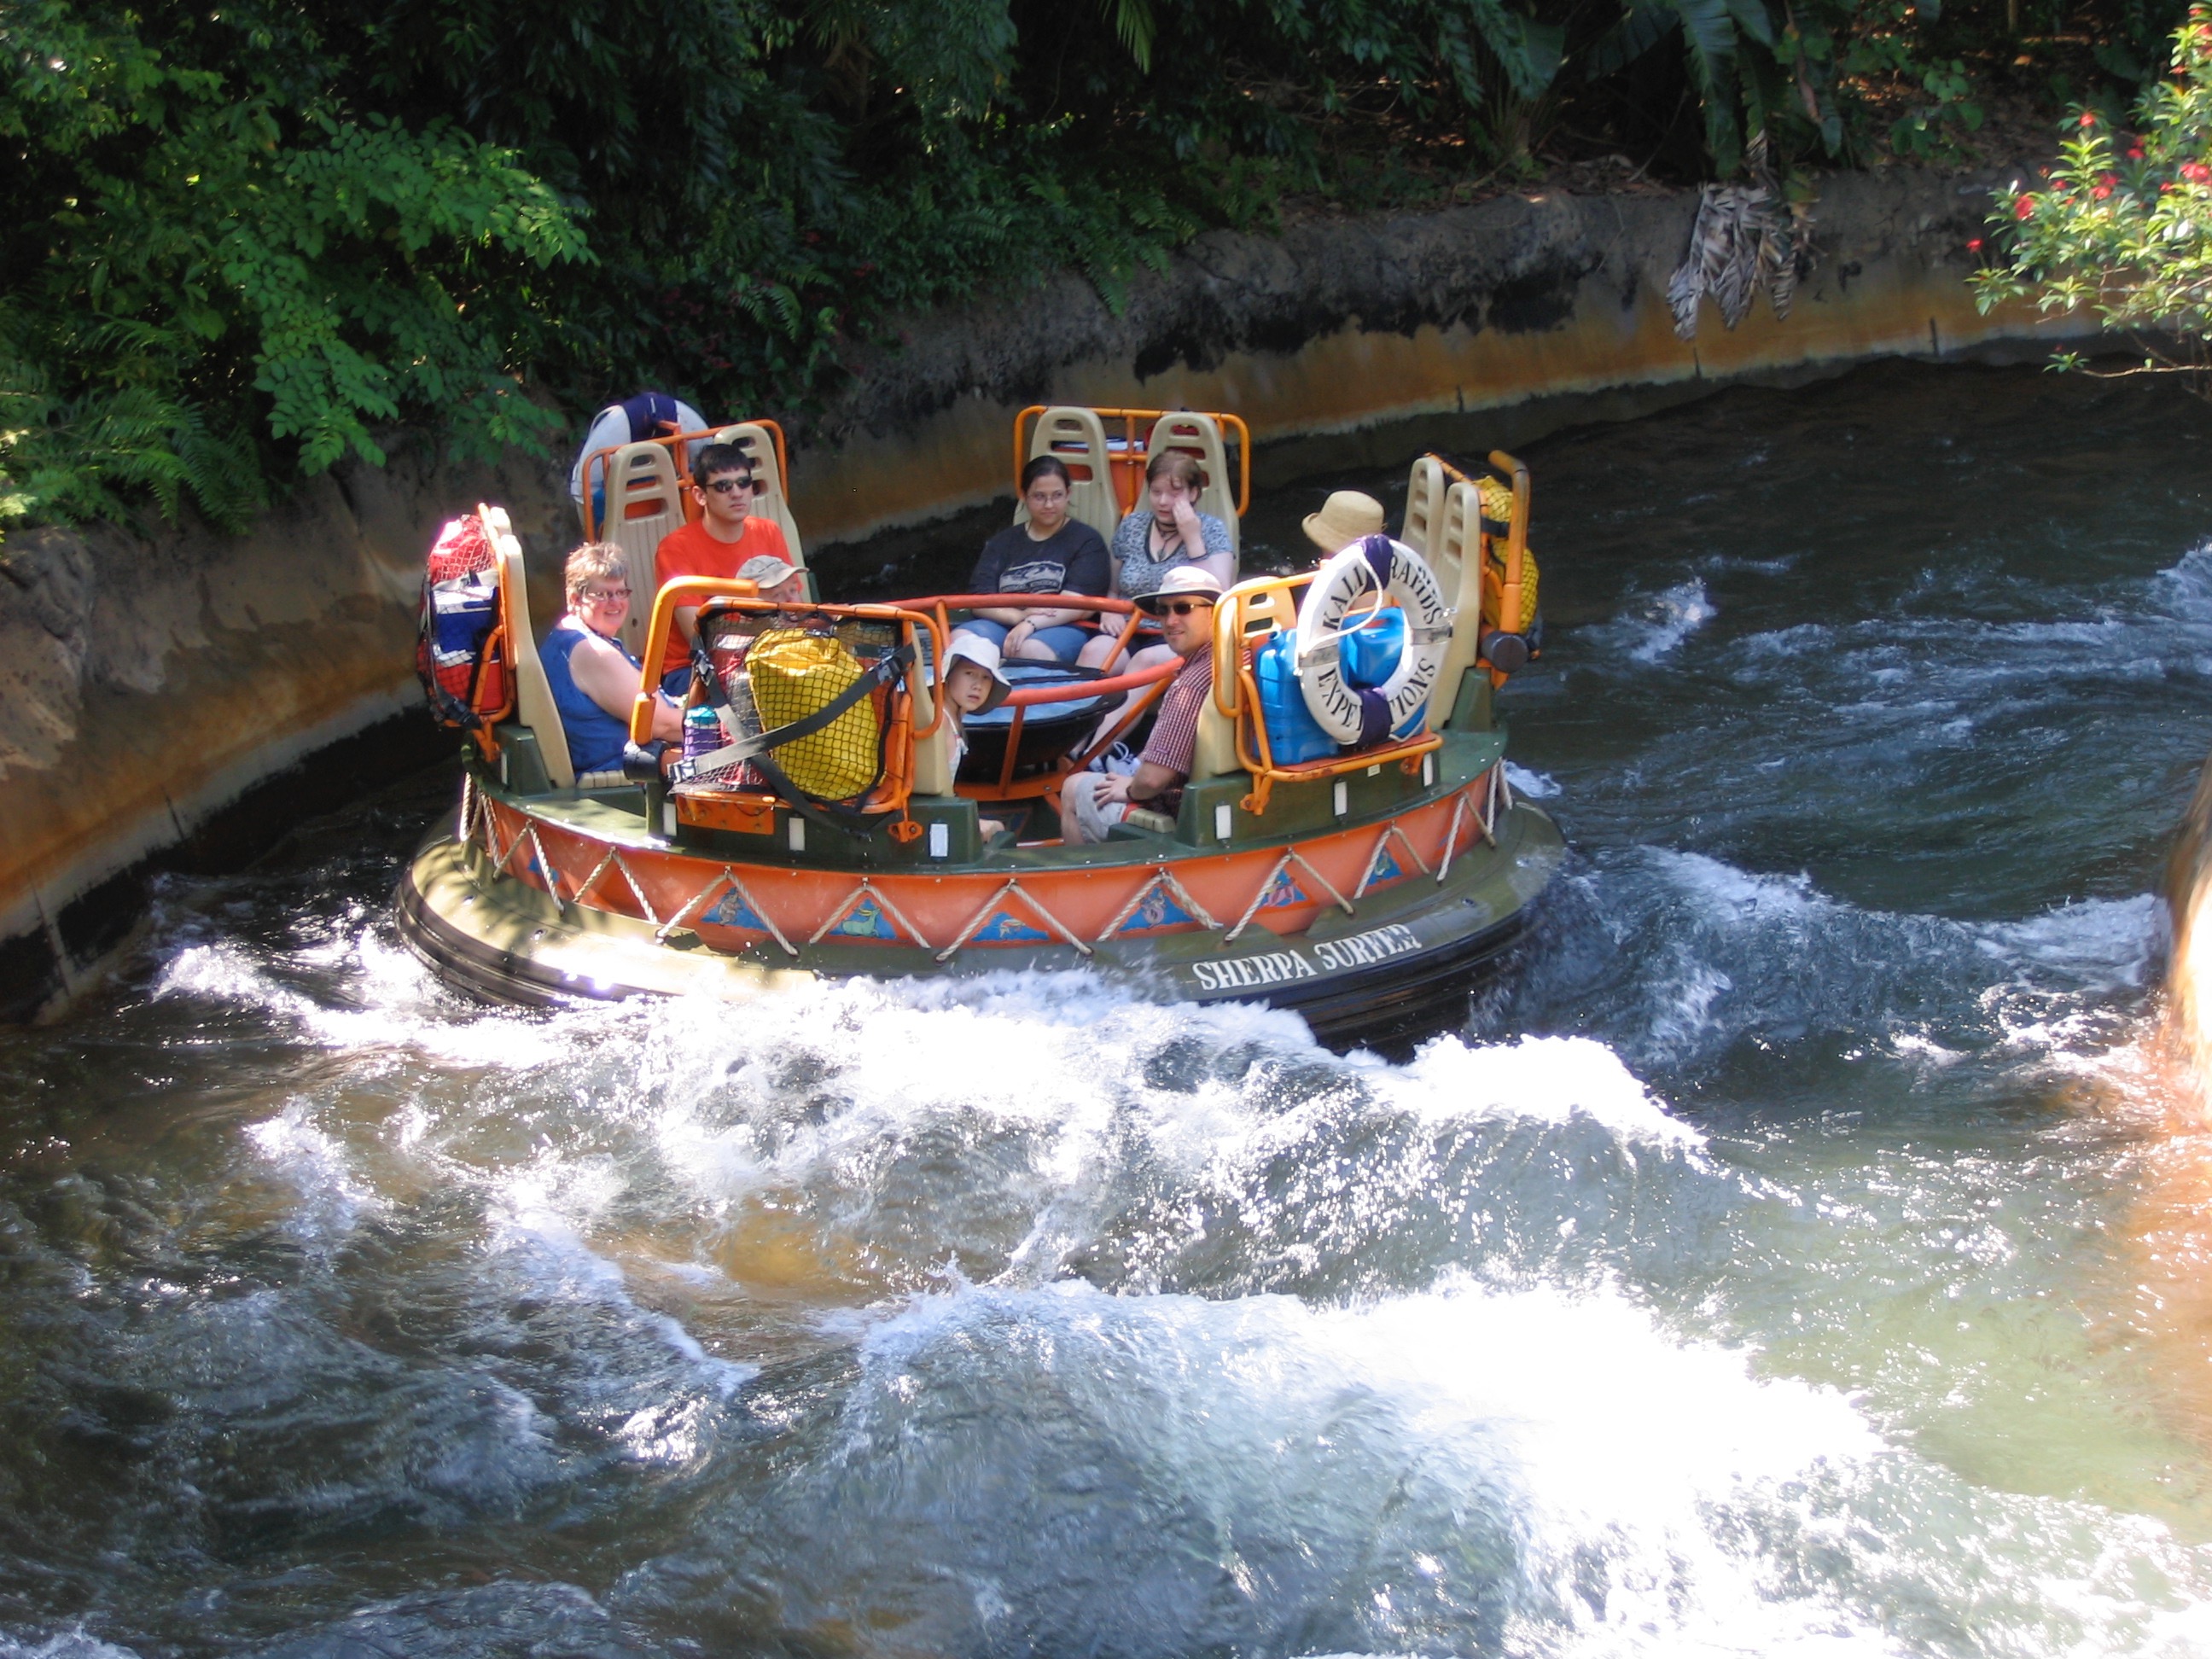
The worst offender of the past week was Kali River Rapids, which was unexpectedly down for approximately 26% of the past week. More than a quarter of the whole week! The worst day for Kali River Rapids was on July 21st, when it was unexpectedly down for 70% of the day. But there were quite a few days where it was down at least 20% of the day.
Even more of a bummer, there was another attraction at Walt Disney World that was down over 20% of the week – Space Mountain lost 22% of its capacity to unexpected downtime in the past week. That’s another big loss!
Rope Drop Downtime
Here are this week’s problematic offenders:
- Magic Kingdom: Big Thunder Mountain Railroad (unavailable for 33% of its first hour of the day), Space Mountain (unavailable for 24% of its first hour of the day), Winnie the Pooh (unavailable for 17% of its first hour of the day)
- EPCOT: Test Track (unavailable for 16% of its first hour of the day), Journey Into Imagination with Figment (unavailable for 14% of its first hour of the day)
- Hollywood Studios: Rock’n’Roller Coaster (unavailable for 33% of its first hour of the day), Runaway Railway (unavailable for 25% of its first hour of the day), Star Tours (unavailable for 14% of its first hour of the day)
- Animal Kingdom: Kali River Rapids (unavailable for 26% of its first hour of the day)
This is another bad rope drop week. Not as bad at Hollywood Studios, although the Rock’n’Roller Coaster/Runaway Railway combo is rough for anyone who isn’t immediately hitting Slinky or Rise (or who loves alliteration with the letter R?) Magic Kingdom mountains were hit hard, and Test Track having issues means rope droppers from the main entrance have to rush to catch up with the folks from the International Gateway.

Wait Times July 18 – 24
Attractions with the Highest Average Posted Wait at each park
- Animal Kingdom: Flight of Passage, average posted wait time of 102 minutes (98 minutes last week)
- Magic Kingdom: Seven Dwarfs Mine Train, average posted wait time of 88 minutes (81 minutes last week)
- Hollywood Studios: Slinky Dog Dash, average posted wait of 88 minutes (87 minutes last week)
- EPCOT: Test Track, average posted wait time of 62 minutes (58 minutes last week)
In a continuation of the weird slight inversion of summer crowds (dipping in early July rather than peaking in early July), wait times continue to creep upward this week at the most popular attractions. At Animal Kingdom especially, a lot of this was thanks to a lot of downtime pushing up wait times at the attractions that were still open.
Parks with the Highest and Lowest Average Wait
These parks likely won’t change week-to-week unless something ridiculous happens, but these data points will give us a high-level view of how wait times are trending from week to week.
- Highest: Hollywood Studios, average park-wide posted wait of 43 minutes (43 minutes last week)
- Lowest: EPCOT, average park-wide posted wait of 24.5 minutes (23 minutes last week)
Not much change at a park-wide level this week. Hollywood Studios held steady and EPCOT saw a slight uptick in overall wait times. Nothing to write home about, but also not a huge drop heading into late summer.
Most Inflated Posted Wait Times
We all know that Disney inflates their posted wait times on purpose. They have many reasons for doing this. Some are totally understandable, and some are potentially more problematic. We can figure out how much posted wait times are being inflated by comparing submitted actual wait times from the Lines App and the posted wait time when the person timing their wait entered the line.
Over the past week, actual wait times in the Lines App averaged 65% of what was posted. This is slightly above our historical average. If the posted wait time was 60 minutes, you could’ve expected to wait over 39 minutes instead.
But the worst offender for the past week is Na’vi River Journey. At this one attraction, submitted actual wait times were 43% of posted wait times in the past week. That means that if Na’vi River Journey had a 60 minute posted wait, you probably would’ve waited just under 26 minutes instead. Less than half of what was posted. Remember to always check the Lines app for predicted actual waits instead of believing what is posted.

Actual Wait Time Rock Star
The Actual Wait Time Rock Star for the past week was … familyboswell, who submitted 46 actual wait times through the Lines App over the last 7 days! This includes 2 Lightning Lane waits, 37 Standby waits, 2 single rider waits, and 5 virtual queue waits. Thank you for all of that timing, familyboswell! You didn’t quite make it to the all-time record of 78 recorded wait times in a single week, currently held by psymonds.
In the upcoming week, timed waits for character greets from the Lightning Lane would be incredibly helpful!
Looking Ahead: July 25 – 31
Food and Wine Festival is back, baby! Typically this doesn’t impact wait times (and therefore crowd levels) too much. Instead it just makes the parks feel much more crowded. You’ll want to start avoiding EPCOT on weekend evenings as locals and park hoppers take advantage of food booths to round out their calories for the day.
Otherwise, expect more of the same in the upcoming week. Crowded Mondays, things calming down through the week and bottoming out over the weekend, and then popping back up the following Monday. Halloween parties start on August 11th, so in the next couple of weeks those will be the main driver of crowd behavior.
Lots of afternoon thunderstorms forecast for this upcoming week, so make sure you’re prepared for that lovely Florida liquid sunshine (or torrential downpours) and that you have a plan for things to do when outdoor attractions shut down.
You May Also Like...
-

We're something like officially halfway through the summer, and well past the peak summer Walt Disney World crowds! We're falling back…
-

We finally get to talk about July 4th! Seems odd now that we're about halfway through the week, and we've already…
-

What a week! Annual Passes back on sale, both Maleficents getting their fire-breathing capabilities revoked, new container-cabins announced for Fort Wilderness…
-

Usually I use this intro to write a few clever lines about the current season, and then tease the fact that…
I survived Studios on 7/24 (thanks to the things Touring Plans taught me)!
We pointed ourselves at RotR, but no dice, so we pivoted to Smugglers Run. Finished there, we still had a short (less than 50) wait for RotR. Genie+ got us Slinky, MMRR, and another Smugglers Run in the afternoon. The midday was all shows (Indy, Frozen, Muppets, and Lightning McQueen) and a last-minute Sci-Fi reservation. We had a Savi’s appointment at 5:20 and called it a day.
The crowds really only got to us when we tried to redeem a Midway Mania Lightning Lane, and the line for LL redemptions stretched back to the Toy Story Land sign. Still, for a crowd level 9, it felt pretty good.