
WDW Wait Time Review – July 2021
It’s the last Saturday in July! The past month has definitely been the busiest one in the parks since they reopened last summer. But just how bad have wait times been? And do we see any trends across the past month? Let’s explore together and see what we found out at each of the four WDW parks.
Explain the Math!
I pulled all wait times from the month of July. One thing to note – in order to write this post for today, I had to pull the data on Friday, which means that I’m really summarizing wait times from July 1 through July 29th. Let’s do a quick refresher on the different types of wait times that we’ll be talking about (or if you don’t like reading about it, you can hear Fred do a crash course in wait time types here):
- Disney’s Posted Wait Times: These are the numbers you’ll see on the signs at the entrance to each ride throughout the parks.
- Submitted Actual Times: These are wait time timers that people in the parks have submitted via the Lines app when they’re in the park experiencing queues and rides.
- Estimated Actual Times: These are the TouringPlans estimates for what you’ll actually be waiting. We update them throughout the day based on real-time input, and you get the most up-to-date estimate by refreshing the Lines App or by re-optimizing or re-evaluating a plan that you have built.
Animal Kingdom

For the month of July, we have over 19,750 posted wait times from Animal Kingdom, and 946 actual wait times submitted through the Lines app. We got the most actual wait times from users waiting for Expedition Everest – 231 of them.
Overall, in July, the average posted wait time across all of Animal Kingdom was 43.3 minutes. But the average actual wait time submitted by users was just 29.1 minutes (compared to 33.6 minutes in July 2019). The ride with the highest average posted wait time was Flight of Passage, with an average posted wait time of 116 minutes throughout the month. That’s the highest average posted wait of any ride in any of the four parks. It also had the highest average actual wait time of any ride at WDW, with its average actual wait time of 73 minutes for the month. The ride at Animal Kingdom with the lowest average posted wait time was TriceraTop Spin. It had an average posted wait of 11 minutes in July. But its average actual wait was even lower – just 6 minutes.
Why those difference between posted and actual? Remember that Disney tends to inflate posted times for various reasons. In fact, for the 946 submitted times from July, the actual wait time averaged only 64% of the posted wait time. The TouringPlans estimated wait times were much more realistic – actual wait times averaged 96% of the estimated wait time at Animal Kingdom in July.
If we look at specific rides, the one that had the least accurate posted wait times for the month was Expedition Everest. For July, actual wait times at Expedition Everest were just 57% of what was posted when the user entered the line. The most accurate posted wait times were found at TriceraTop Spin, where the average wait was 105% of what was posted. Our TouringPlans estimates, unsurprisingly, performed much better. The least accurate estimates were at DINOSAUR, where actual wait times were just 83% of what we had estimated they would be. And the most accurate estimates were at Navi River Journey, where actual wait times averaged 100% of estimated wait times.
EPCOT

In July, we got more than 25,350 posted wait times from EPCOT, and 970 actual wait times submitted by users of the Lines app. The ride where users submitted the most actual wait times was Soarin’ – we received 226 actual wait times from those high fliers.
EPCOT had the lowest average posted wait time of all four WDW parks in July, at 26.8 minutes. And the average actual wait time submitted by users was even lower – a pretty impressive 15.6 minutes (compared to 17.1 minutes in July 2019). The ride that had the highest average posted wait time was Test Track, with an average posted wait time throughout the month of 67 minutes. Test Track also had the highest average actual wait time of all of the rides at EPCOT, with an average actual wait time of 42 minutes in July. The EPCOT ride with the lowest average posted wait time this month was Journey Into Imagination – it had an average posted wait of 11 minutes. But the ride with the lowest average actual wait time was different. The Seas with Nemo and Friends won that crown with an average actual wait of 5 minutes.
Let’s explore how big the differences were between actual wait times, posted wait times, and TouringPlans estimated wait times at EPCOT. For the 970 submitted times from July, the actual wait time averaged a remarkable 52% of the posted wait time. That’s the biggest miss of any of the four WDW theme parks. The TouringPlans estimated wait times were much more realistic – actual wait times at EPCOT in July averaged 91% of the estimated wait time.
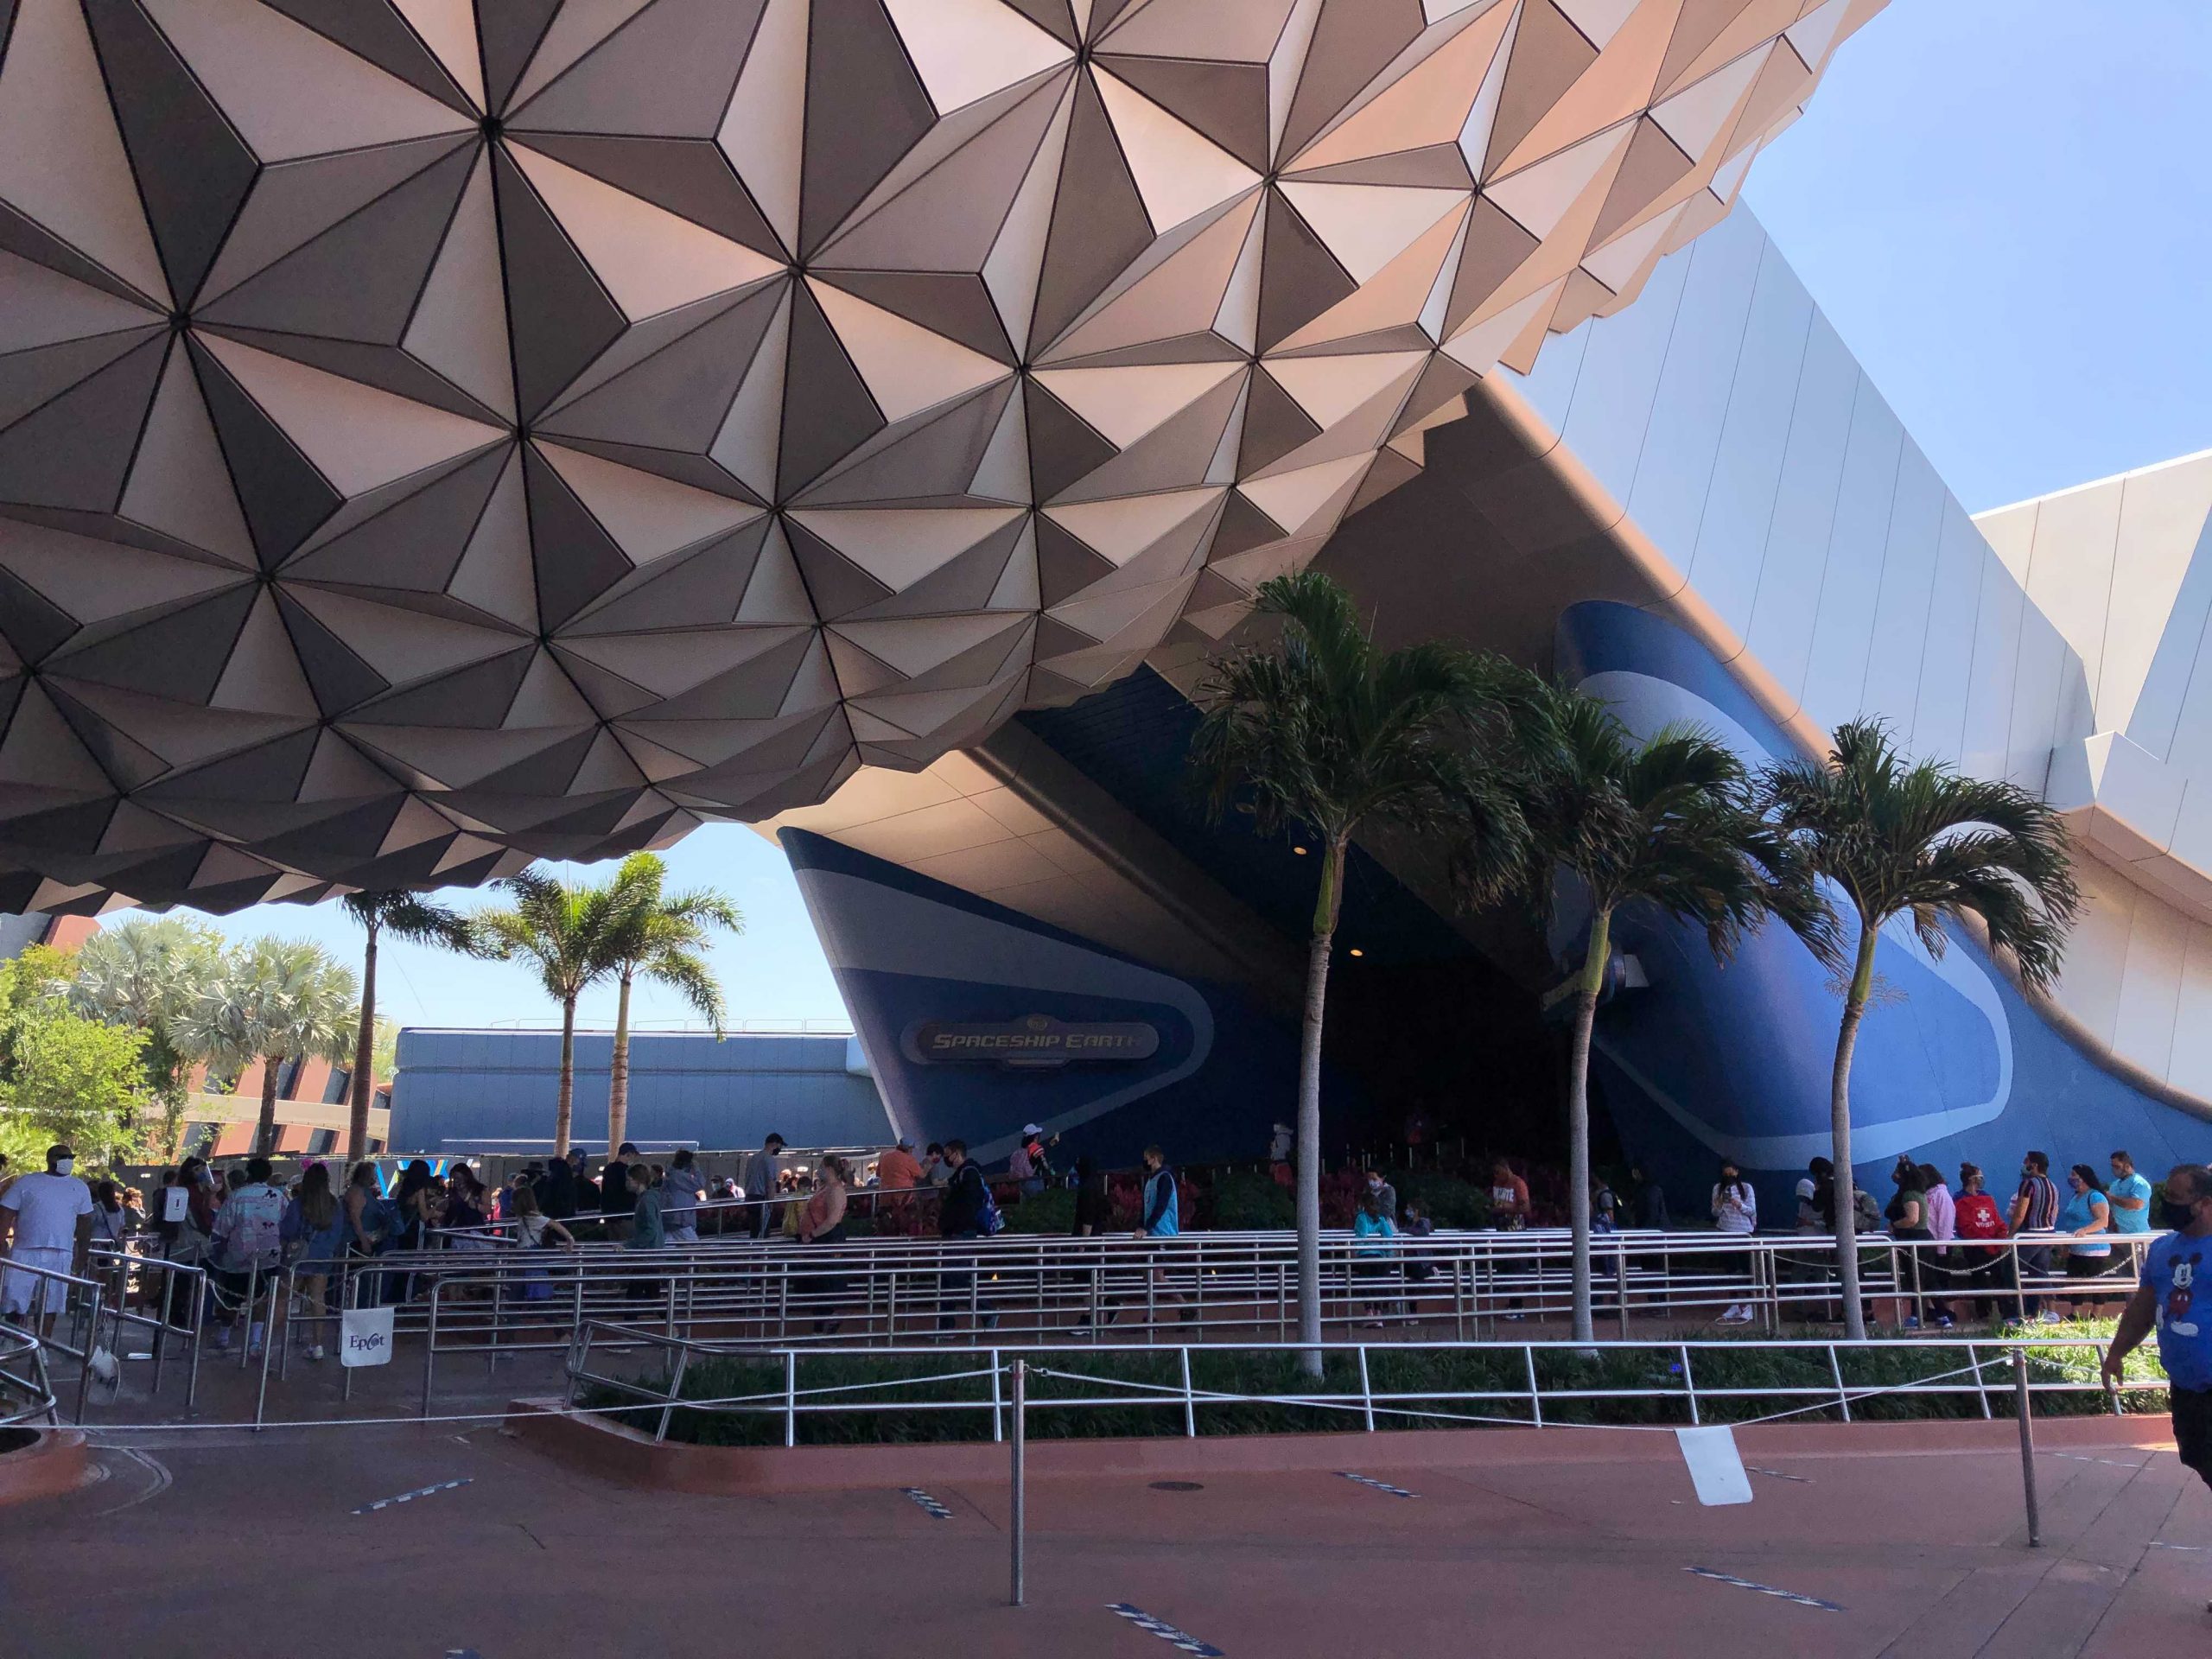
The EPCOT attraction that had the least accurate posted wait times for July was Spaceship Earth. Actual wait times at Spaceship Earth this month were just 34% of what was posted when the user entered the line. 34%!!!! Take what’s posted and divide it by 3, and you’ll have a more accurate picture of that wait time. Spaceship Earth is the attraction with the biggest percentage inflation of posted times of across all of WDW in July. On the other hand, the most accurate posted wait times were found at Frozen Ever After, where the average wait was 80% of what was posted. Thankfully, our TouringPlans estimates were much closer to actuals. The least accurate estimates were at Gran Fiesta Tour, where actual wait times were 81% of what we had estimated they would be. And the most accurate estimates were at The Seas with Nemo and Friends, where actual wait times averaged 105% of estimated wait times.
Hollywood Studios

Over the past month, we got more than 32,500 posted wait times from Hollywood Studios, and 1,365 actual wait times submitted by Lines app users. The attraction that had the most wait time submissions was Toy Story Mania!, with 293 actual wait times.

Hollywood Studios had the highest average posted wait time of all four WDW parks in July, at 43.8 minutes – it just nudged out Animal Kingdom for that dubious distinction. But the average actual wait time submitted by users wasn’t quite as bad as what was posted, at 33.4 minutes (compared to 34.0 minutes in July 2019). The attraction with the highest average posted wait time was Slinky Dog Dash, with an average posted wait time of 89 minutes for July. But it was Millennium Falcon: Smugglers Run that had the highest average actual wait time of all of the rides at Hollywood Studios, with an average actual wait time of 54 minutes for the month. The attraction at Hollywood Studios with the lowest average posted wait time this month was MuppetVision*3D, with its average posted wait of 13 minutes. And it also had the lowest average actual wait time of just 8 minutes throughout July.
Hollywood Studios is the park with the least-inflated posted wait times for the month of July. For the 1,365 submitted times from this month, the actual wait time averaged 67% of the posted wait time. So, posted times average out to be the most accurate here, but you’ll still be waiting just 2/3 of what is posted. The TouringPlans estimated wait times were once again more reliable – actual wait times for July at Hollywood Studios averaged 91% of the estimated wait time, just like at EPCOT.
The attraction at Hollywood Studios that had the least accurate posted wait times this month was Star Tours – actual wait times at Star Tours this month were 49% of what was posted when the user entered the line – less than half. The most accurate posted wait times were found at Slinky Dog Dash. At Slinky Dog Dash in July, the average wait was 87% of what was posted. Once again, our TouringPlans estimates averaged much closer to actuals. The attraction with the least accurate estimates for the month was MuppetVision*3D, where actual wait times were 78% of what we had estimated they would be. Tower of Terror had the most accurate estimates, with actual wait times averaging 98% of estimated wait times.
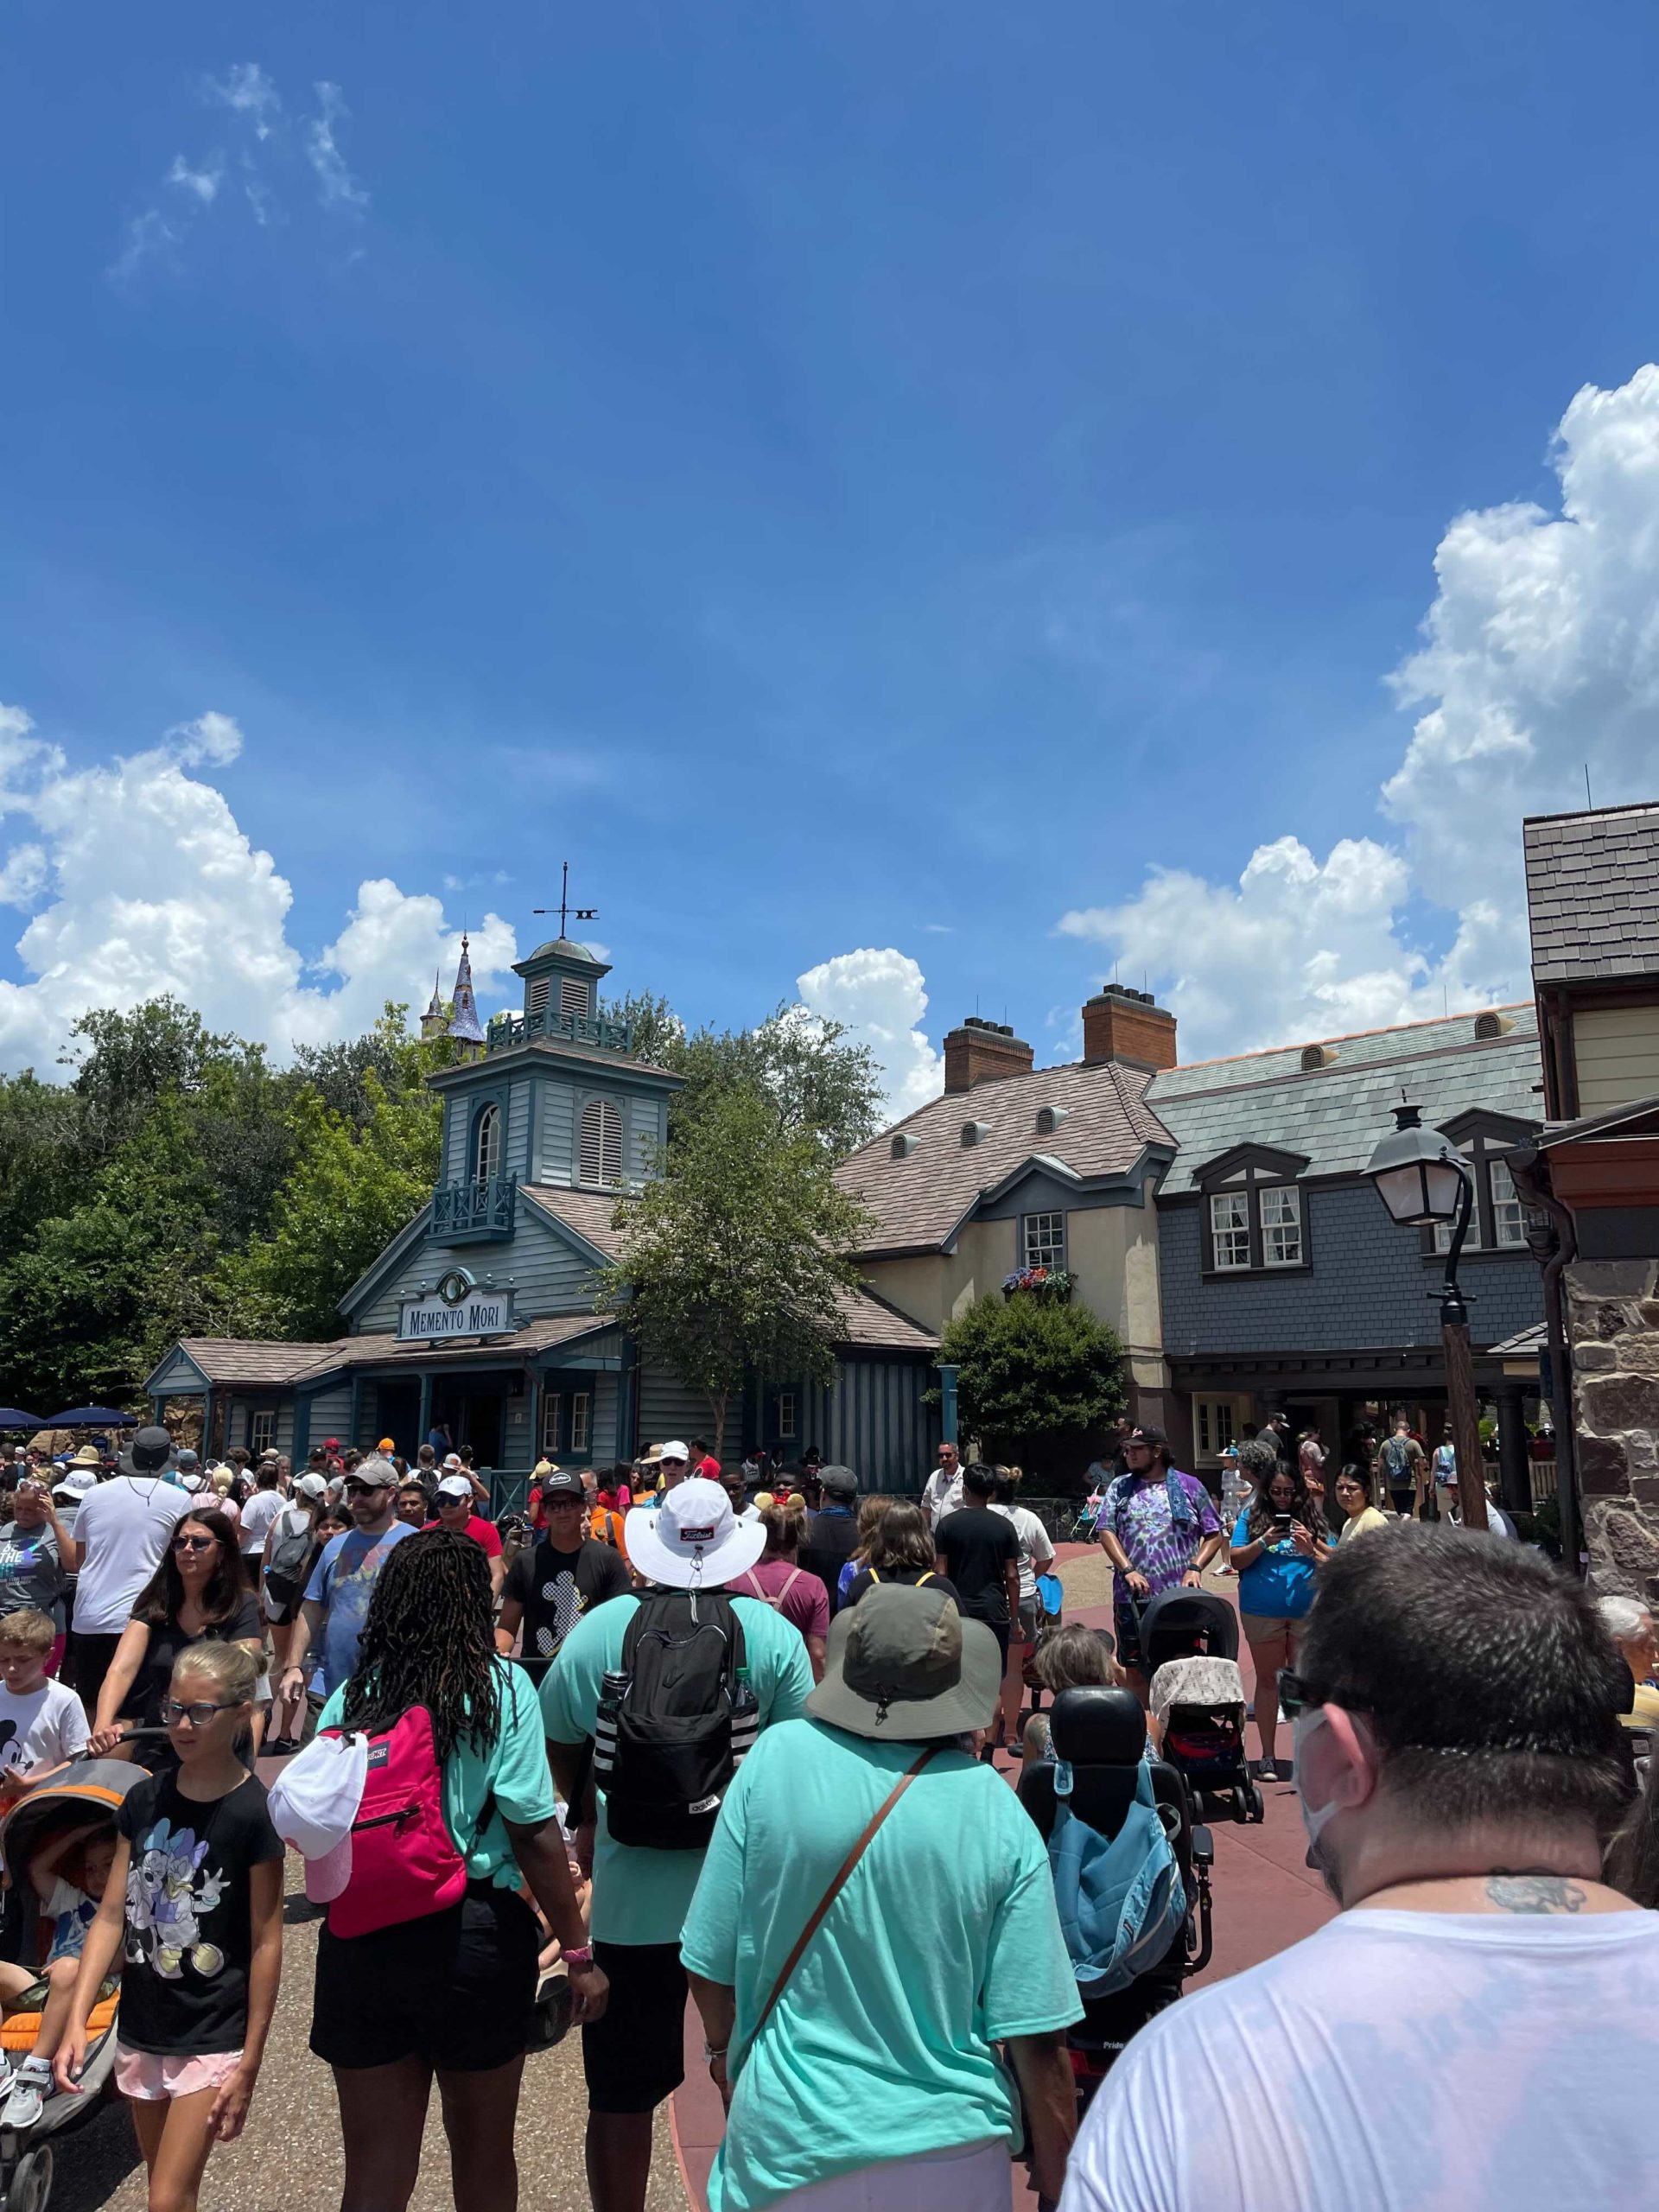
Magic Kingdom
We received more than 73,000 posted wait times from Magic Kingdom in July, as well as 2,932 actual wait times submitted by Lines app users. Magic Kingdom blows all other parks out of the water as far as volume of data we have to work with. The attraction that had the most wait time submissions was Big Thunder Mountain Railroad, with 354 actual wait times by itself.
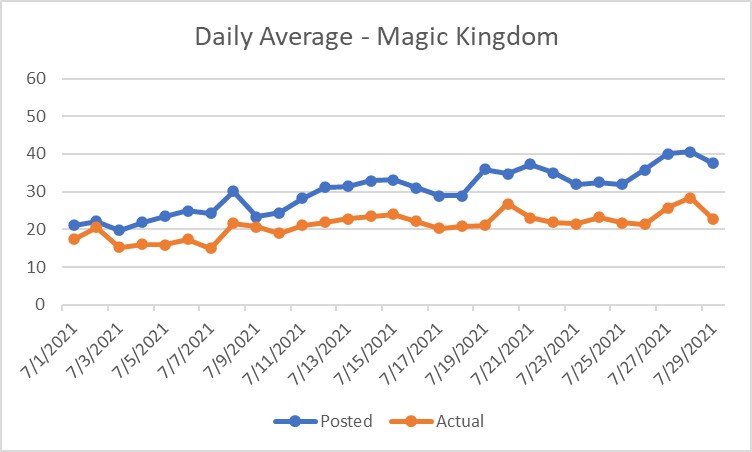
Magic Kingdom’s average posted wait time for July was 33.3 minutes. But the average actual wait time submitted through the Lines app wasn’t that high, at 21 minutes (compared to 18.5 minutes in July 2019). Seven Dwarfs Mine Train had the highest average posted wait for the month, clocking in at 77 minutes. It also had the highest average actual wait time of all of the rides at Magic Kingdom this month, but the average actual wait time was a more reasonable 42 minutes. The attraction at Magic Kingdom that had the lowest average posted wait time in July was Carousel of Progress, with its average posted wait of 6 minutes – that’s the lowest average posted wait of any attraction at any park. It also had the lowest average actual wait time of any attraction at any park, with an average actual wait of just 3 minutes throughout July.
For the 2,932 submitted times from this month, the actual wait time averaged 60% of the posted wait time. But the TouringPlans estimated wait times were more accurate – actual wait times for this month at Magic Kingdom averaged 91% of the estimated wait time. That matches EPCOT and Hollywood Studios.
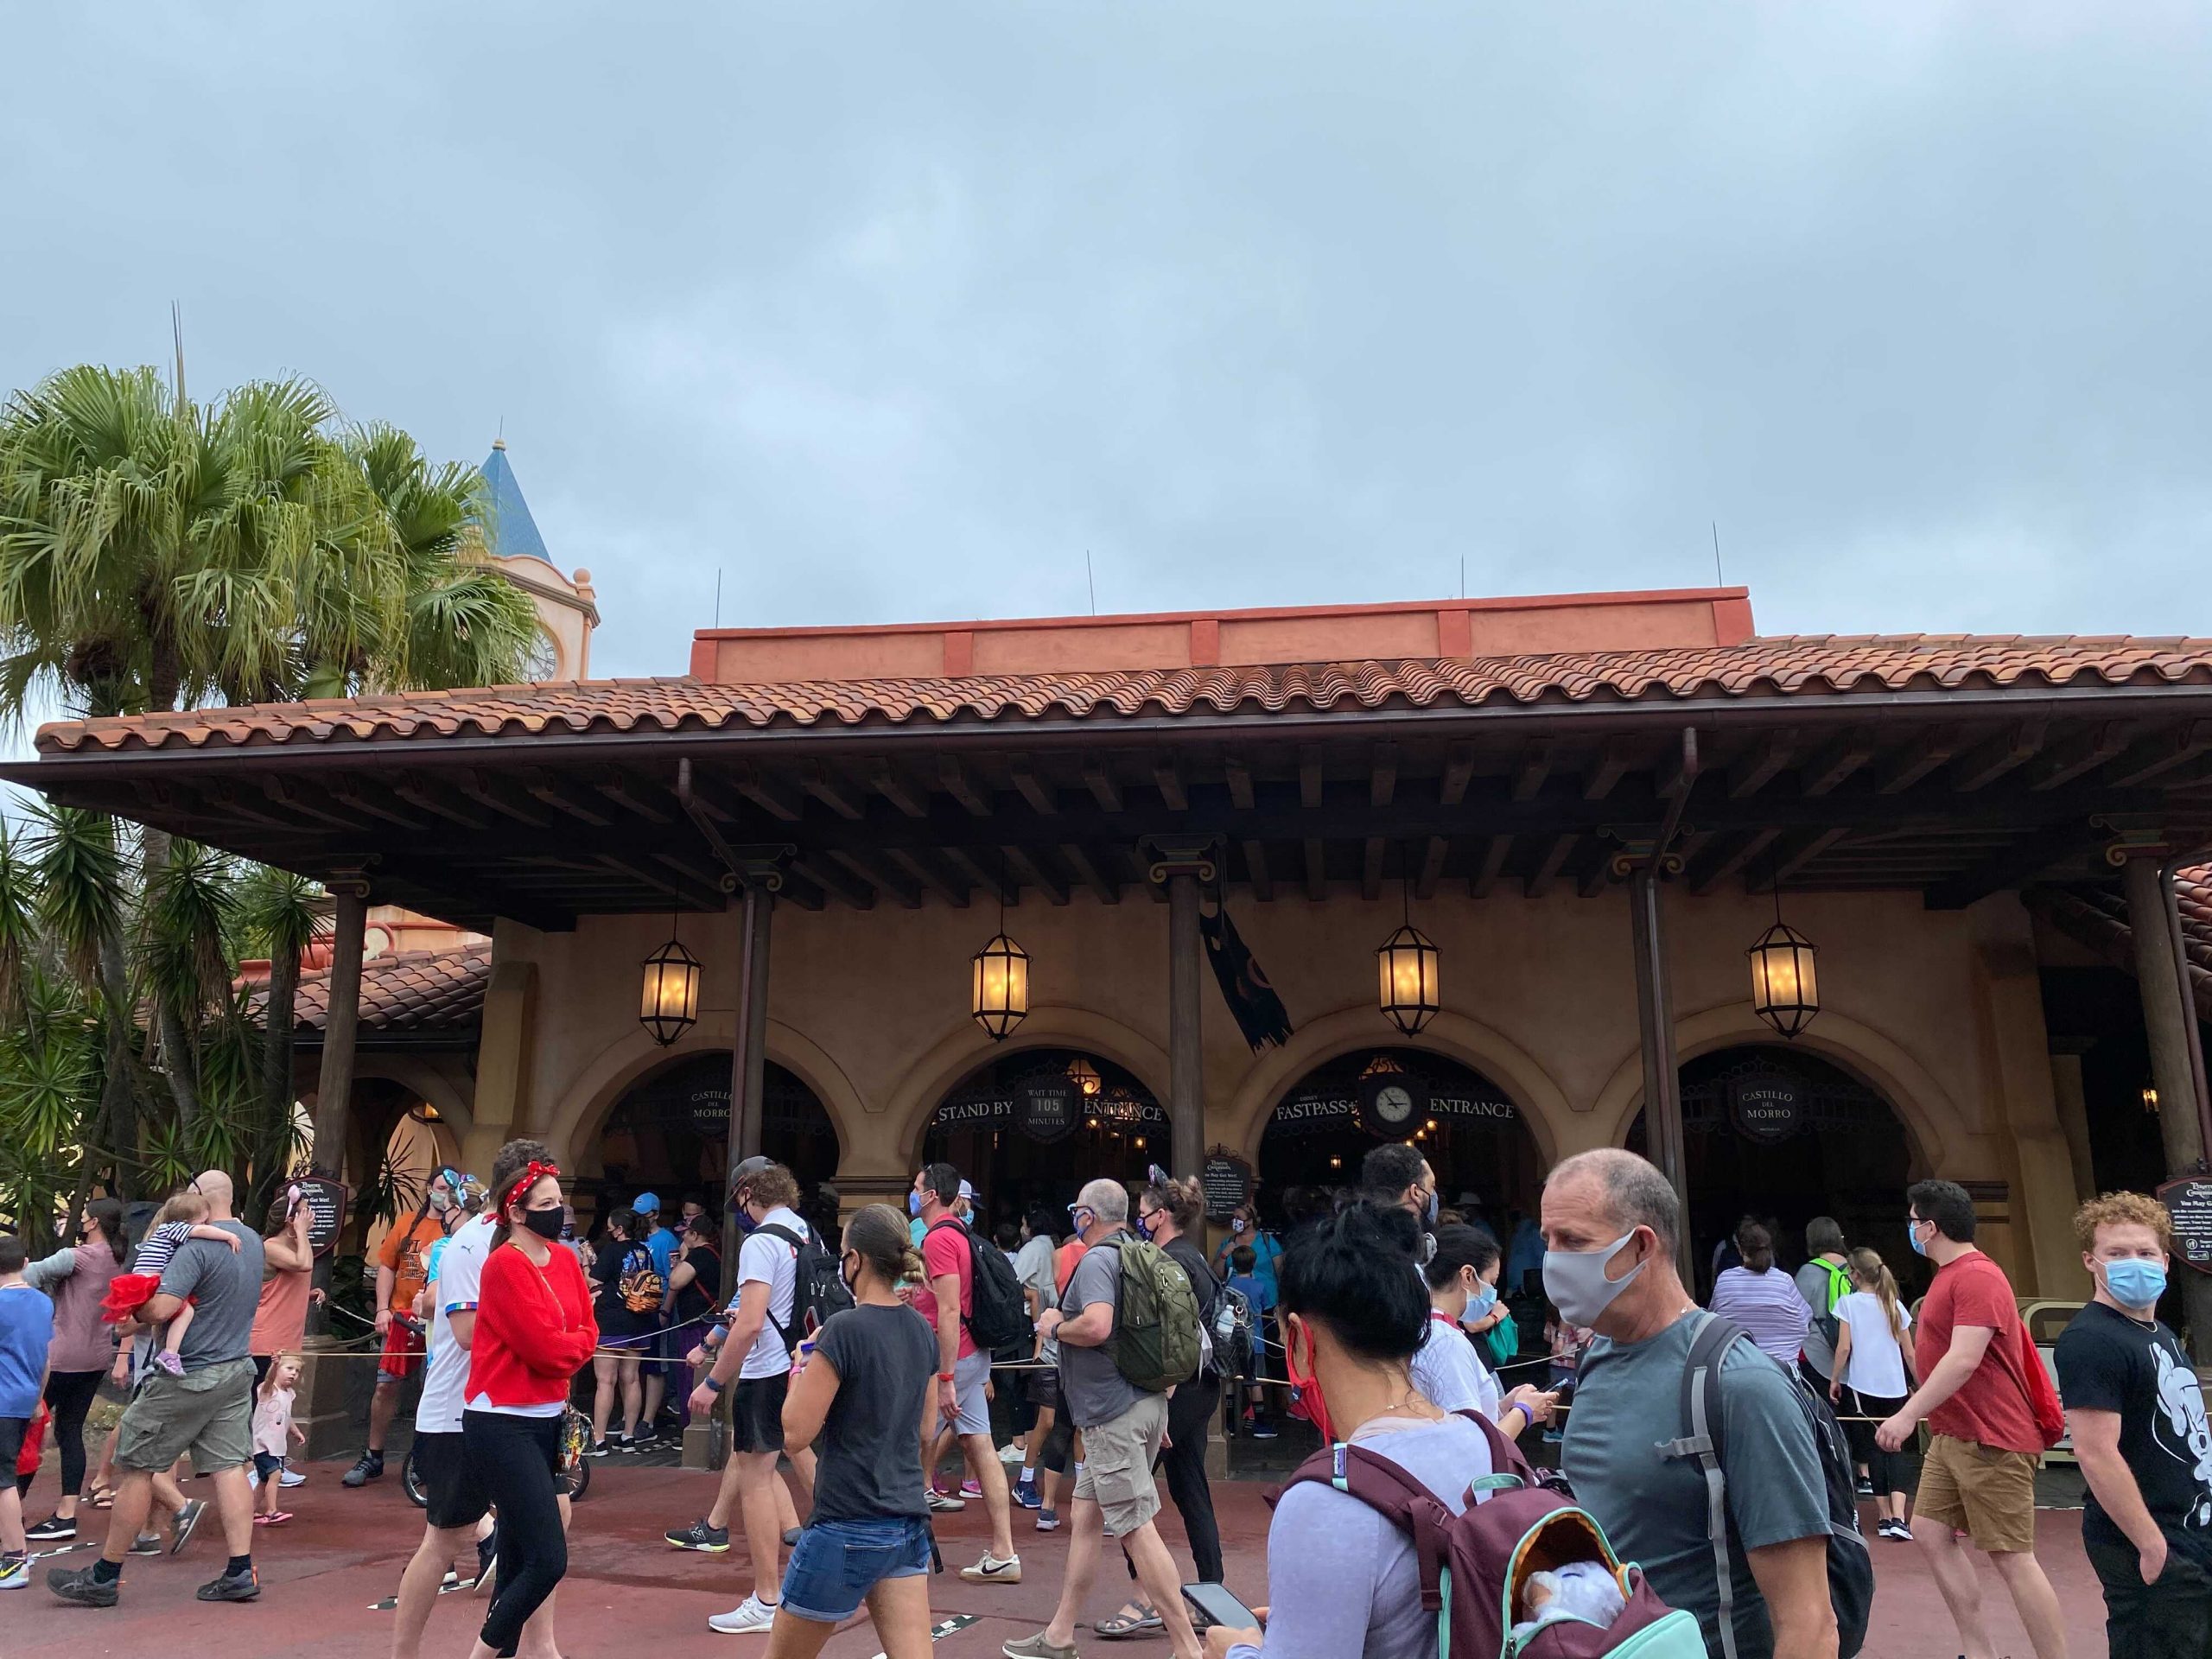
The Magic Kingdom attraction with the least accurate posted wait times for July was Pirates of the Caribbean, where actual wait times were 38% of what was posted when the user entered the line. We got a good real-life example of this during Chrissy’s posted vs actual test earlier this month. The most accurate posted wait times, on the other hand, were for Tomorrowland Speedway. At the Speedway this month, the average wait was 76% of what was posted. Not a particularly great look when your most accurate posted times are still almost 25% off from being accurate. Actually, the least-accurate TouringPlans estimated waits were almost identical to the most-accurate posted waits from Disney. The attraction that had the least accurate estimates for July was Seven Dwarfs Mine Train – actual wait times there were 75% of what we had estimated they would be. The Many Adventures of Winnie the Pooh had the most accurate estimates, with actual wait times averaging 100% of estimated wait times.
What Does This Mean For You?
- Actual wait times have increased throughout the month of July. But they’re still lower than or in line with standby waits from pre-pandemic summer.
- Posted wait times have generally increased by more than actual wait times during the month of July. So don’t be totally put off by what you see posted at the entrance of an attraction.
- Posted waits are most inflated at EPCOT, where actual wait times average the lowest out of any of the four parks.
Was this information interesting and/or helpful to you? Are there other data points or metrics that you’d like to see for the past month? Let us know in the comments!

You May Also Like...
-

Last week I saw a nice data visualization of how COVID-19 compares to other causes of death in the United States.…
-

Despite limited attendance at Orlando's "other" theme park, Universal Orlando Resort continues to break crowd level records. Crowd levels have dipped…
-
This Crowd Calendar update just affects November and December 2021. The prior predictions were based on data prior to 2019. We expect…
-

Hold the phone - Becky's writing about Universal again. I know, it's weird. It feels weird. But I've had a few…
It would be interesting to use this method of comparing actual average wait times between months to determine whether the FP program raised standby waits in general or not. Some people swear they had a huge negative effect on lines, and others want it back because it seemed advantageous to them. I’m not a statistician and I’m not sure what months you could use to compare that wouldn’t be compounded by pandemic effects, though. It you can figure out an analysis of FP effects throughout the ages, I’d love to see it!
*confounded