Wait Time Awards! Summer 2022 Edition
I have been writing mostly about all things Genie+ for … what feels like months. And, actually has been months. But even with all of the articles and YouTube videos, I still get plenty of comments and emails and Instagram messages asking for more updates and additions. Which I am totally happy to continue providing. Just not this week. This week we’re going to have a little fun!
This past Saturday, Joe took over the Sat Six and infused a little data into the mix. I don’t know about all of you, but I was a big fan of the result. So I’m going to turn things around and take a little inspiration from Sat Six by handing out some awards. I’m not cool enough to do something like Theme Park Turkeys, though. Instead, we’ll do awards based on wait time data so far this year!

Explain the Math
We’re only looking at standby wait time data for these awards. We’ve had almost 30,000 standby waits submitted through the Lines app so far in 2022 (and over 62,000 in the last 12 months).
That’s it – I’m taking it easy on you this week. Your challenge, instead, is to make hypotheses before I reveal each answer!
Highest Average Wait During Peak Hours
Here at TouringPlans, we define peak hours as 11 am to 5 pm. This is the time of day where wait times are generally highest. We have almost 10,000 wait times from this time period so far in 2022. So what attraction has the highest average actual wait time recorded by TouringPlans users?
Winner: Flight of Passage – 89 minutes
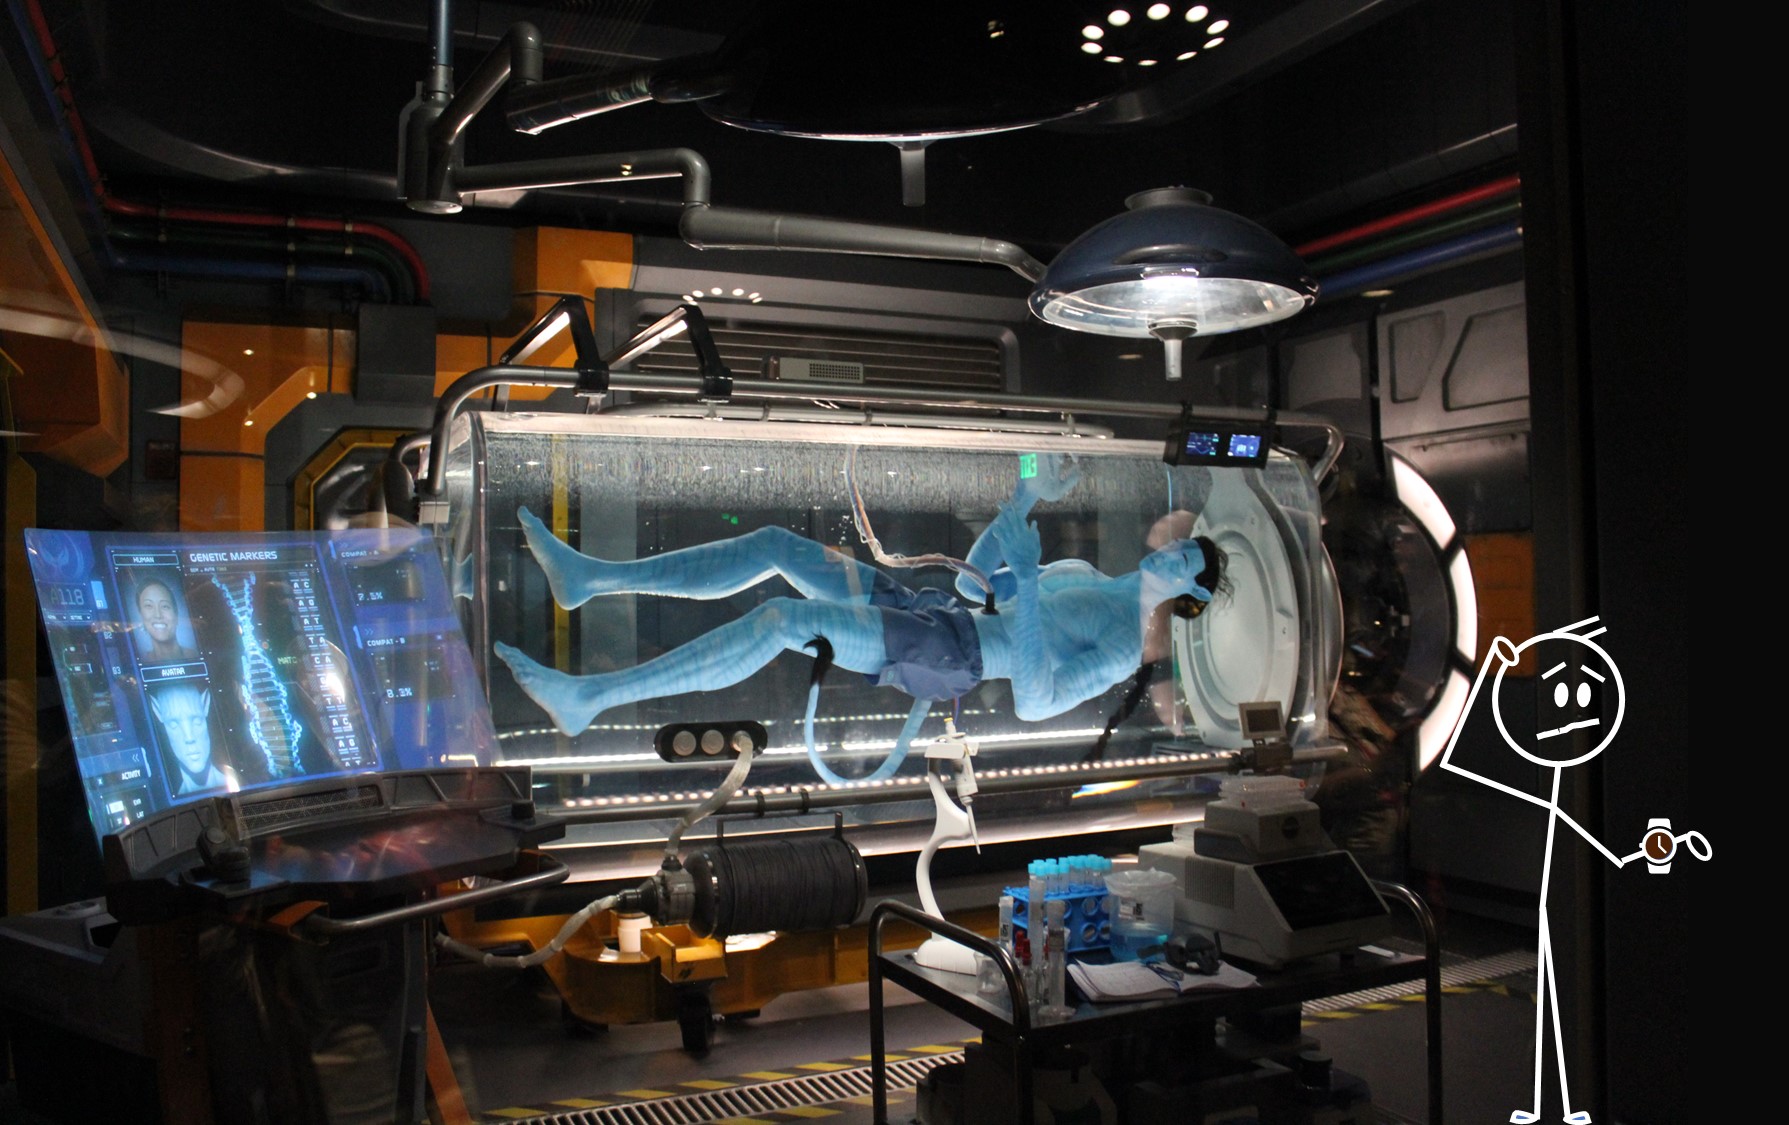
That’s right – averaged across 7 months, you could expect to wait about 90 minutes in standby to experience Flight of Passage sometime between 11 am and 5 pm. The really fun thing is that these are Liners! The folks that should know how to avoid 90-minute waits. Ha! So …. thank you for enduring the long waits so that we can get more data?
This is also really counter-intuitive. Pretty much everyone “knows” that Rise of the Resistance has the longest standby waits of any attraction. But that also means more folks purchase Individual Lightning Lane for it, etc. It ends up that we had more people willing to get in line at higher wait times for Flight of Passage. Enough to push it into first place.

Runners Up: Rise of the Resistance – 86 minutes; Slinky Dog Dash – 70 minutes; Seven Dwarfs Mine Train – 65 minutes
Lowest Average Wait During Peak Hours
Now, this is an interesting one. Which ride can you almost always walk on to? We have to exclude things like shows. We want something with some sort of real, variable wait. But surely there is an attraction we can crown as lowest wait of all.
Winner: Gran Fiesta Tour – 6 minutes

Where’s the love for Donald?? I think I’ve figured out the problem. Folks head toward Gran Fiesta Tour and then they get distracted by La Cava because we’ve covered it so much. Well, stay strong, friends. Resist the siren call of the The Lily and enjoy the boat ride. You never know, you might catch an animatronic glitch and get your social media coverage to go viral. #goals
Runners Up: Journey Into Imagination with Figment – 7 minutes; The Seas With Nemo & Friends – 8 minutes; Spaceship Earth – 8.5 minutes.
What have we learned here? Go to EPCOT if you want low standby waits during peak hours.
Biggest Evening Drop-off
We call the peak hours a “peak” for a reason. Typically, wait times drop in the evening. But this happens at different rates at different parks and attractions. So which attraction should you hop to at night?
Winner: Kilimanjaro Safaris – 65% drop in wait times

The average wait at Kilimanjaro Safaris during peak hours so far this year is 37 minutes. After 5 pm, when it has been open, that’s dropped to just 13 minutes. No one likes a pre-sunset Safari? I always recommend one early-morning and one late-day Safari to folks that are in Animal Kingdom all day. And you might as well try it out if you’re only waiting 13 minutes.
Runners Up: The Seas with Nemo & Friends – 63% drop; Expedition Everest – 63% drop; Peter Pan’s Flight – 58% drop
Most Posted Wait Time Inflation (%)
Okay, remember when I said we were only looking at standby actual wait times? I lied. It happens occasionally. But it’s been a minute since we’ve talked about wait time inflation, and it’s a much more fun to talk about than that other type of inflation that’s everywhere right now. It just means that we have to add in some posted wait times to our data too.
Winner: Gran Fiesta Tour – Actual wait 47% of posted wait

Our first double winner! It makes a bit of sense that our lowest average wait will also have the biggest posted wait time inflation. Gran Fiesta Tour is often a walk-on, so that default 5 minute posted wait is already quite inflated. We’re not unveiling some big conspiracy with this one.
Runners Up: Buzz Lightyear – Actual wait 50% of posted wait; Peter Pan’s Flight – Actual wait 52% of posted wait; Frozen Ever After – Actual wait 55% of posted wait
Special note – if we define wait time inflation in minutes instead of by percentage, then your winner is Seven Dwarfs Mine Train with an average of 29 minutes of inflation. It’s followed by Slinky Dog Dash with 26 minutes of inflation, and Peter Pan’s Flight with 26 minutes of inflation.
Most Submitted Actual Wait Times
Which attractions are Liners submitting the most times for? It’s probably a popular, repeatable sort of attraction. But not one with huge waits that would mean our savvy folks would be using Lightning Lane or otherwise somehow avoiding standby …
Winner: Big Thunder Mountain Railroad – 1232 waits in 2022
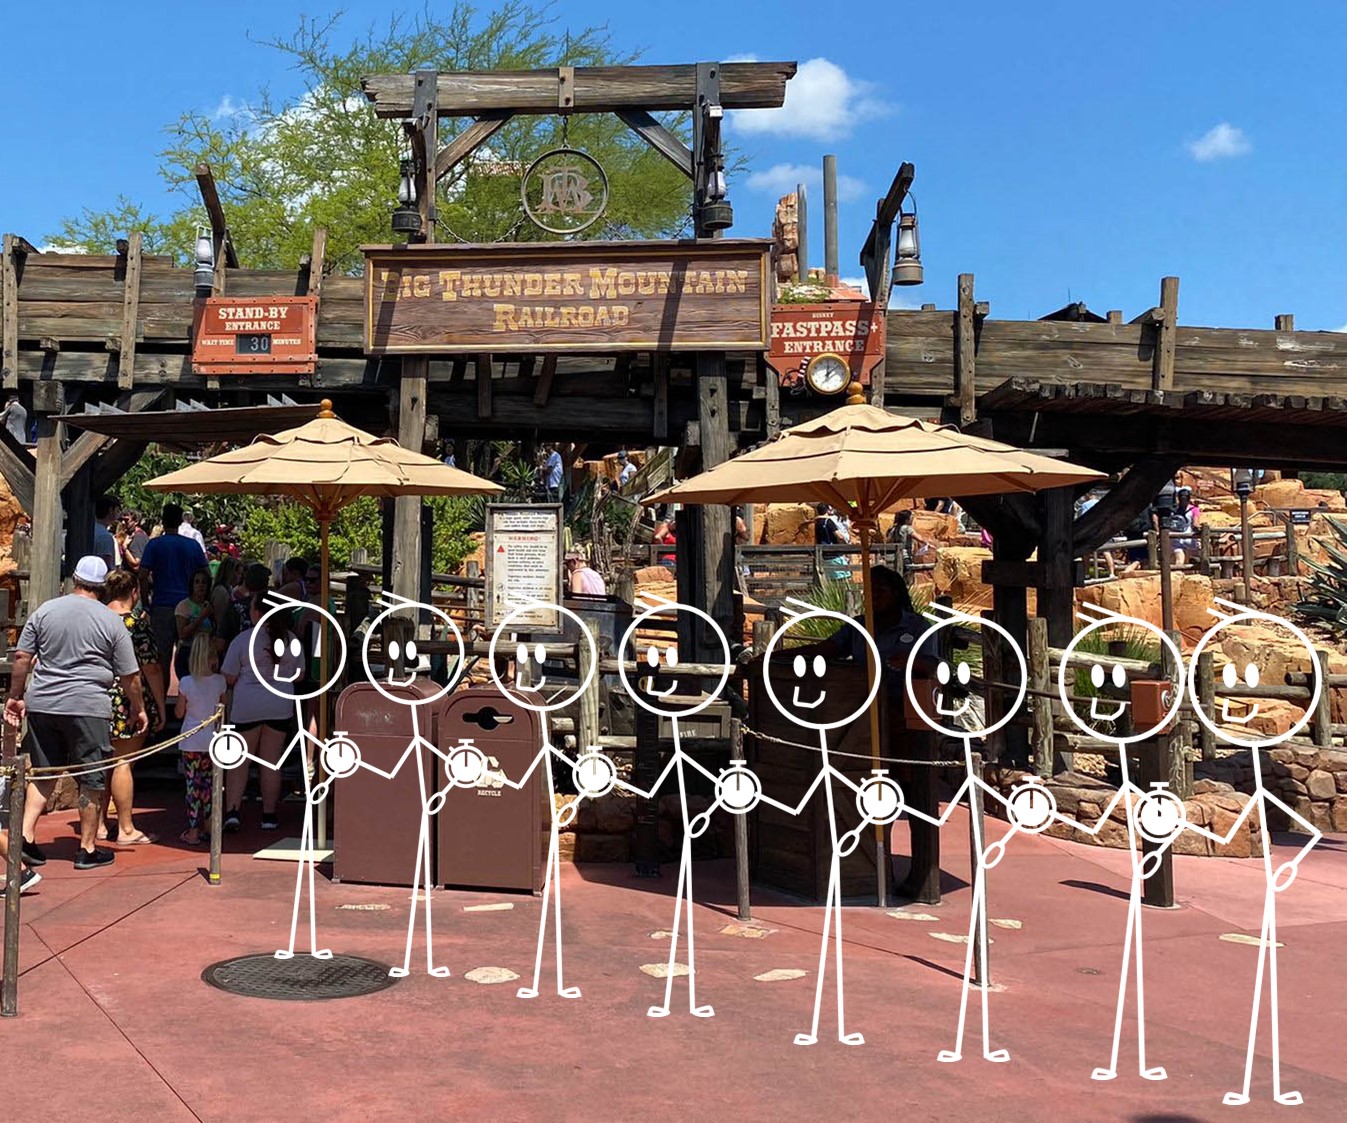
Aha, this makes sense to me. Part of the mountain range, but with more manageable waits than most of the other big headliners at Magic Kingdom. Lots of fans of the wildest ride in the wilderness.
Runners Up: Pirates of the Caribbean – 1230 waits (so close!); Runaway Railway – 1183 waits; Haunted Mansion – 1141 waits
Another note – we have very few recorded wait times for character meet-and-greets. So if you’re waiting in those lines at any park, please submit your standby waits and I’ll be super-appreciative!
Most Erratic Wait Times
I was going to call this unpredictable, but that does a big disservice to the smart folks doing the TouringPlans and Lines predicting, so we’ll go with most erratic. And the way I’m measuring this one is standard deviation of submitted actual wait times. Big standard deviation = big swings in submitted actual wait times = actual wait times are ALL over the place. And to normalize, I’ll be dividing by the average peak wait time.
Winner: See Anna and Elsa at Royal Sommerhus – Average wait 13 minutes & standard deviation 12.5 minutes

This one immediately stands out as a good example after my family visited EPCOT a little over a week ago. The posted wait time for Anna and Elsa bounced around from 5 minutes to 45 minutes to 10 minutes … and we eventually essentially walked right in to meet them. I suspect this is due to the number of Anna(s) and Elsa(s) available at any given time, as well as spike-y demand from a lot of young families.
Runners Up: Mission: SPACE Orange – Average wait 18 minutes & standard deviation 13.5 minutes; See Olaf at Celebrity Spotlight – Average wait 13 minutes & standard deviation 10 minutes; See Mickey at Town Square Theater – Average wait 17 minutes & standard deviation 12 minutes
So what have we learned here? Character meets have wait times that swing around a lot. So if meeting characters is important to you, keep an eye on wait times either on Lines or MDE and be opportunistic about when you hop in line.
That’s all of our awards for today! If you have other superlatives you’d like to hand out, or other analyses you’d like me to run, drop them in the comments.
You May Also Like...
-

It's the last Saturday in July! The past month has definitely been the busiest one in the parks since they reopened…
-

Wait times at Disneyland Resort are up - way up! Since June 1, Disneyland Park has seen crowds levels hit a…
-

Although cruising has yet to resume on Disney Cruise Line, signs are looking positive that ships could once again sail the…
-

We've gotten many variations of a single question (or complaint) recently, and they all go something like this: "I used Lines…
How about some rope drop touring plans? With early entry, we managed Rise, Millennium Falcon, and Buzz Lightyear before our 9 AM Genie+ Slinky Dog reservation. That was a good day.
Rope dropping is still the best time not spent on lines.
Great post!
Pretty upsetting…but not surprising..that an Individual Lightning Lane ride like Seven Dwarfs Mine train has the highest ride time inflation based on minutes!! Some shady stuff. Has there been an archive tracking this to see how many minutes they are inflating to try to convince people to buy Individual Lightning Lanes?? Like, once they sell out do the inflation numbers decrease??
A lot of us theorized that WDW would inflate the numbers to sell more ILL….looks like we were right.
Just like how Disney inflated food prices to sell the dining plan.
Legoland NY opened last year and started their paid line skipping program this year. I noticed they had 60 minute wait times listed the entire day for the major rides, but they were all 15 minutes to walk on, even during peak hours. It makes me mad they are blatantly try to scare people into buying it. I’m glad we have the data to back it up.
I’ve been paying attention to the evening drop off rides, I plan on taking advantage of that, especially at AK and HS for our trip in 2 weeks!
This isn’t recent but may help:
https://touringplans.com/blog/are-wait-times-more-or-less-accurate-for-individual-lightning-lane-attractions/
Great post! (as usual) Love these data driven posts about wait times–super helpful, and entertaining!