What About Downtime at Disneyland?
Last week I wrote something ridiculous like 3000 words all about how downtime at Walt Disney World is so awful and getting worse (see here for parks data, and here for attraction-specific data). I stand behind those words – things aren’t trending well, and even a park with an average of 3-4% of capacity lost every day due to downtime shouldn’t be acceptable. And yet … you clever readers, you, asked me to compare it to Disneyland. And I’ll go ahead and say that I was shocked by the results.
In today’s post we’ll look at how overall capacity lost due to downtime at the west coast parks compares to the east coast parks for all of 2022. And then we’ll pair up specific sets of identical (or almost-identical) attractions so that we can determine if we can identify any trend.
Explain the Math
If you look up any past date in the crowd calendar (Disney World or Disneyland), you’ll see information about capacity lost due to downtime for each park. And if you look at any wait times graphs for any attraction for any date in the past, you can also tell when a ride is down by the lack of posted wait times for a specific time period.
For this post, we’ll be looking at two different questions and sets of data:
- At the park-wide level, are parks on the west or east coast experiencing more capacity loss due to unexpected downtime?
- When comparing similar attractions on each coast, which one loses less capacity due to unexpected downtime?
Which Park Has the Worst Capacity Issues?
One note before we dive in – we don’t have two full years of data post-reopening for Disneyland or California Adventure. That means trending isn’t really fair, since there are some similar weather cycles there, although they are much smaller in scale and peak at different times than those at Walt Disney World.
So we’re going to compare data from 2022, so far. Those almost-6-months on both coasts contain very similar of percentages of total average rainfall on both coasts, so even though it hits different parts of the weather cycle, it’s as fair of a comparison that we can get right now.

These numbers aren’t just visually striking – they’re statistically significant. Both Disneyland and California Adventure lose more capacity due to downtime than any of the Walt Disney World parks. In fact, capacity issues at Disneyland mean that every hour, on average, attractions with unexpected downtime could have handled 2120 additional people if they were up. And at California Adventure that same number is 1450 people. That’s equivalent to Big Thunder Mountain being down all day every day at Disneyland, or Toy Story Midway Mania being down all day every day at California Adventure. Not great.
Even crazier? At Walt Disney World, there are three attractions with over 10% average capacity lost due to downtime so far this year. On that west coast, that number of attractions rockets up to SEVEN.

- Golden Zephyr and Silly Symphony Swings are both highly susceptible to wind, and both have insanely high capacity lost due to downtime. Golden Zephyr has been down almost two full months out of the previous six. On my recent trip, it was down the whole 2 days other than for a window of about 2 hours. Boo.
- Indiana Jones is complicated and … aging. Weird to say, but I’ll say it. It hasn’t closed for more than 3 or 4 days of refurbishment since 2017.
- Grizzly River Run is one of those trick water attractions, and then we come to my nemesis. I’m glad it’s on the list and that it doesn’t just hate me.
- Incredicoaster and Matterhorn round out the “above 10%” club. Both complicated, outdoor-track attractions. They fit the mold as being unreliable and closing relatively often.
Attraction Comparison
Outdoor Attractions

The above chart compares attractions that appear on both coasts, and that are more susceptible to weather-related closures.
- Mad Tea Party is an interesting case here, because at WDW it is under a sort of roof, and at DLR it is more open to the elements.
- Dumbo sees differences in downtime that aren’t statistically significantly different between both coasts.
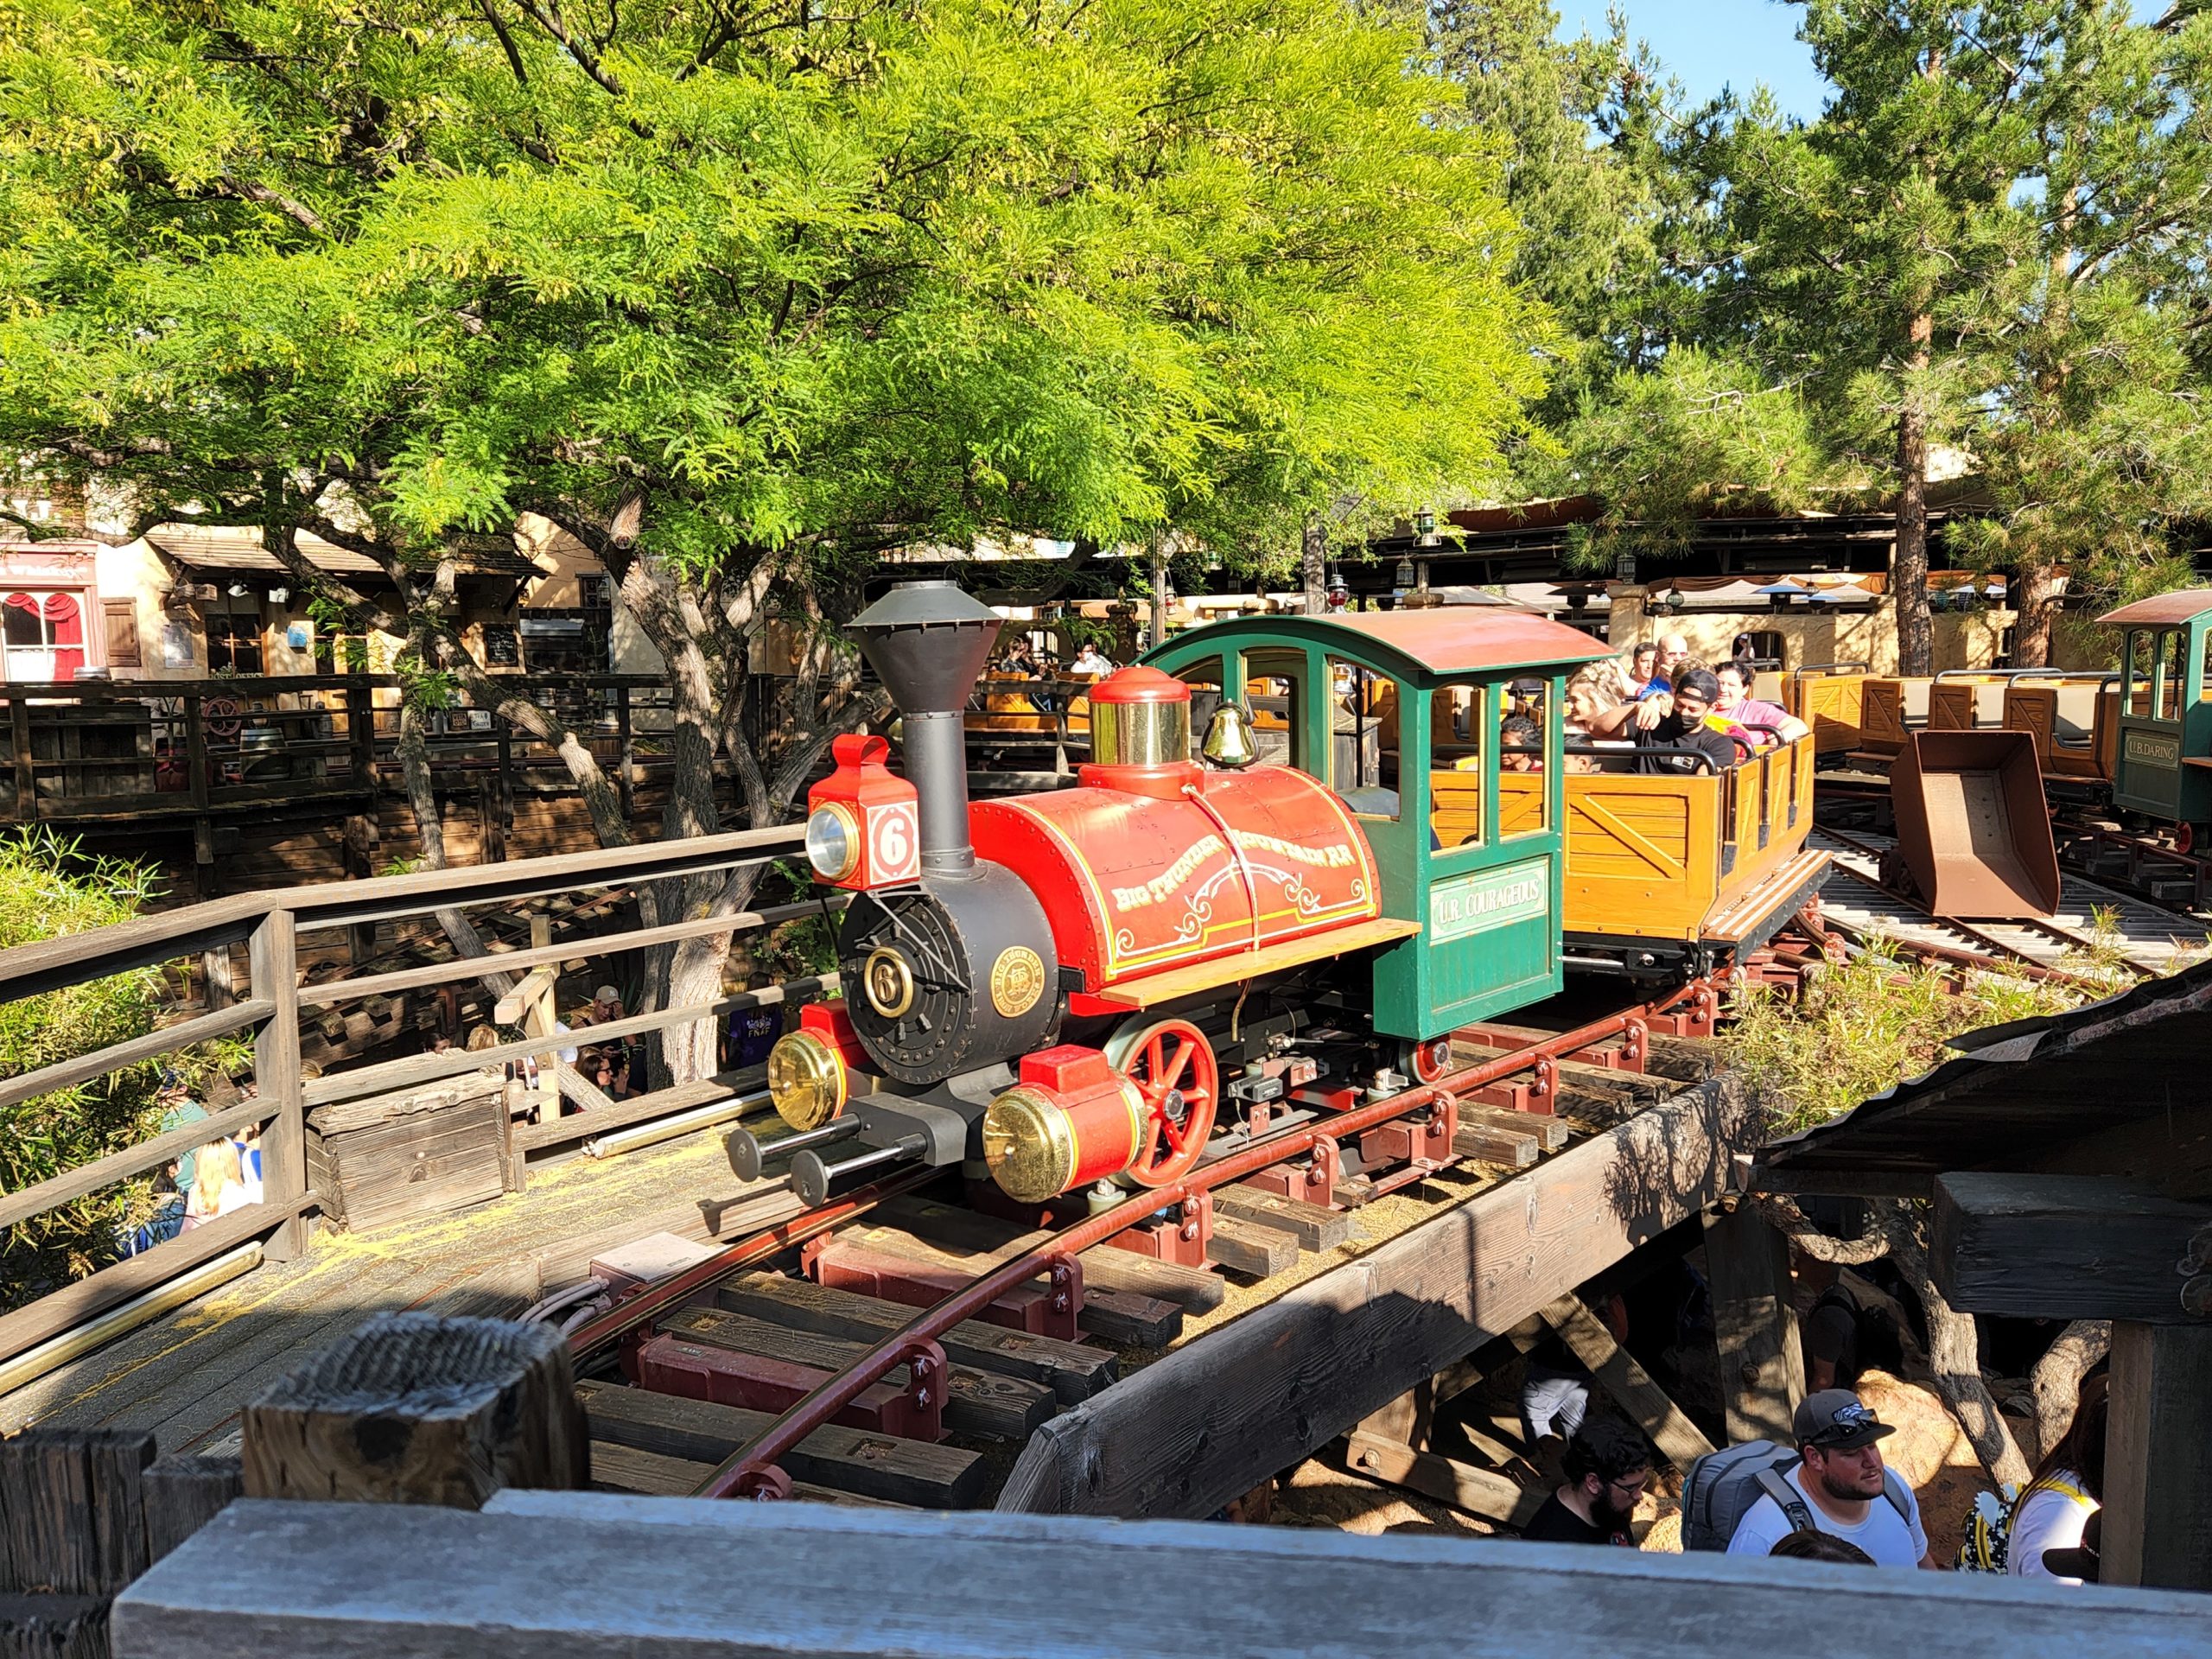
- And the other cases come out to almost an even comparison – Splash and Astro Orbiter have more downtime at Disney World, while Big Thunder and Jungle Cruise have more downtime as Disneyland.
Indoor Attractions

- First, let’s call out which attractions have no appreciable difference in downtime between the coasts – Buzz Lightyear and Mickey’s PhilharMagic are each a wash.
- Once we rule those out, there are only two attractions that have worse downtime issues at Walt Disney World than their counterparts at Disneyland. Those are Tower of Terror (slash Mission: Breakout) and Pirates of the Caribbean. We already discussed last week that Tower of Terror is a bit of an anomaly right now – its stealthy refurbishment means that it is much more susceptible to unexpected closure than normal. And Pirates of the Caribbean at Disneyland has a small sample size – it’s been closed for refurbishment since March 14th.
- Every other comparison here turns out to favor Walt Disney World. Sometimes by impressively large amounts, like at Fantasyland favorites Peter Pan’s Flight and it’s a small world.
- Some of these differences can at least be partially explained by attractions having more backup options at Walt Disney World – like Toy Story Mania having more tracks at Hollywood Studios than it does at California Adventure, or Soarin’ having more theaters in EPCOT than it does at California Adventure. Other attractions … not so much.
What Does This Mean For You?
- In a weird turn of the “Be Fair to Florida” movement, at least Florida has less downtime issues than California. Yay?
- Generally, outdoor attractions have better luck in Disneyland than they do at Disney World. That being said, attractions in some parts of California Adventure are particularly susceptible to wind. If you want to go on something like Golden Zephyr or Silly Symphony Swings, do it at low-wind times.
- At Disney World, some attractions benefit from having more space and therefore having built-in backups for themselves. When theses backups are down for things like refurbishments, then downtime goes crazy.
Were you as surprised as I was by the large amount of lost capacity due to downtime at Disneyland and California Adventure? Have you experienced any downtime on your Disneyland trips? Let me know in the comments!

You May Also Like...
-

It's wild to think that Disney California Adventure is already 20 years old. Unfortunately the park is still mostly closed during…
-

What a ride it's been. In July 2020, Walt Disney World reopened after the COVID-19 shutdown, while Disneyland Resort remained shuttered.…
-

Ha HA! The article that none of you saw coming. Because I always write about Disney World. I occasionally write about…
-

Disneyland has announced new reduced-rate ticket offers for Southern California residents! Southern California residents guests may experience Disneyland Park or Disney…
How does Web Slingers compare?
My first thought is that (on average) Disneyland rides are older and therefore more susceptible to breakdowns.
At least when rides are down in Disneyland I can comfort myself with the far superior food!
Ha! Love that you’re looking on the bright side 🙂
Particularly bad form for DLR since it’s is rare that any Southern California attraction would be closed because of rain!
Why the discrepancy in your numbers for DLR Big Thunder? In one chart you show >10%, in the next you show <6%.
Good catch, John! I accidentally switched the two columns for that attractions. Naughty naughty. Will get it fixed ASAP!