Crowd Calendar 4 Launched for Universal Orlando and Disneyland Resort

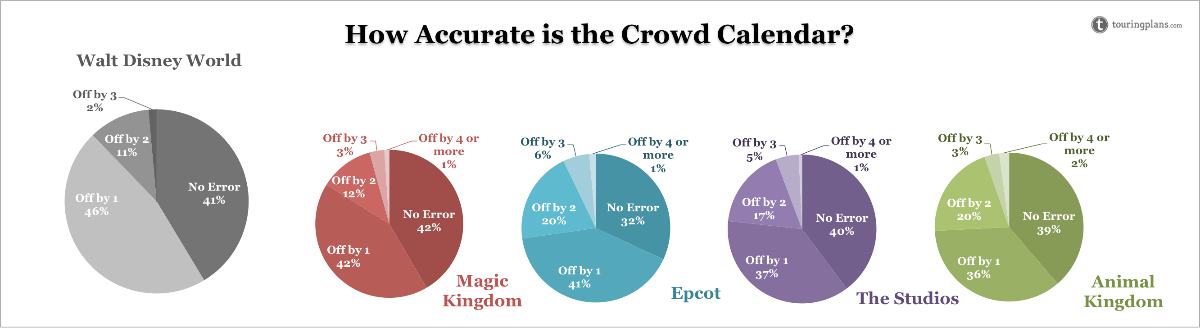
The methodology used for the TouringPlans.com Walt Disney World Crowd Calendar since November 2013 takes over the Universal Orlando and Disneyland Resort crowd calendars starting today. Crowd Calendar 4 has worked well for Disney World so we are confident it will perform equally well for Universal and Disneyland. See below for a synopsis of how the calendar has performed since November 2013. When we predict the crowd level (between ‘1’ and ’10’) we see that about 95% of the time the actual crowd will be within two index points, and about three-quarters (3/4) of the time within one.
We at TouringPlans.com are not usually ones to tout our own greatness but when it comes to the crowd calendar we are proud of how it has performed over the years. We are flattered by the onslaught of other competing calendars that have popped up since we first launched ours in 2004. Of course, as “numbers” people we track them and compare to our own. We are proud to say that the accuracy of our calendar outperforms them all. If you look at all the predictions out there for what the wait times will be ours is the closest to what actually happened 75% of the time. If this were a toothpaste commercial 3 out of 4 dentists would prefer TouringPlans.com. Here’s a table of how our estimates of average posted times performed in the last 30 days.
| TouringPlans.com | Nearest Competitor | ANALYSIS | |
|---|---|---|---|
| Walt Disney World (Overall) |
9
|
13
|
|
| Magic Kingdom |
9
|
11
|
Accuracy is essential and we get closer than anyone else. Four minutes might not seem like much but remember, that is the average error per attraction. Most TouringPlans.com subscribers visit 15 to 20 attractions per day so over a typical day the cumulative difference will be an hour or more. |
| Epcot |
8
|
13
|
|
| Hollywood Studios |
11
|
16
|
|
| Animal Kingdom |
9
|
12
|
|
Here’s a quick refresher for what makes the new crowd calendar new. To read a complete description, check out this post.
Crowd Calendar 4 uses the average posted time at key attractions between the hours of 10:00 am and 5:00 pm. It still uses a ‘1’ to ’10’ scale but no decimal points. You are likely to see more ‘4’s, ‘5’s and ‘6’s and fewer ‘1’s and ’10’s. The fact is, most days at Universal Orlando Resort and Disneyland Resort, like Walt Disney World fall into those middle categories. Days that fall into the extreme categories are becoming less frequent, especially at the low end of the scale.
The new calendar means improvements to our attraction level estimates in Lines too. Here are the key attractions that we use for the calendars. These are the attractions that relate the best to crowds in the park.
We have two favourite parts of Crowd Calendar 4. First, it means that the calendar is more stable over time so changes to the numbers are much less frequent. Second, it is much easier to measure what happened and to compare to what we predicted. Watch for the weekly Disneyland and Universal Crowd Reports where we summarize what happened and how our predictions performed.

You May Also Like...
-

We have had a few weeks to observe the wait times at Universal Orlando Resort since the parks reopened in June.…
-
Disney World parks have reopened and we were surprised to see that Universal Crowd levels appear to be unaffected. Saturday crowds…
-
Everyone's number one priority right now is to help slow the spread of COVID-19 by practicing social distancing. Universal did their…
-

Crowd levels at Universal Orlando Resort continue to hit record highs and our wait time models are underpredicting as a result.…
Hooray! We frequent Universal as much as Disney and this is great news.
My dream would be for you guys to add Sea World Orlando as well in the future – as far as I know, there are no existing crowd calendars for it, so you’d have zero competition 😉