How Much Time Will Genie+ Save Me At Each Attraction?
Update: For Genie+ attractions, there is a newer version of this article with newer data. Click here to read it in a new tab..
The Lines 2.0 App has been collecting Lightning Lane (and standby) wait times for a few weeks now, and our intrepid community of Liners has been submitting their waits – giving us a steady stream of incoming data. With that data comes the ability to start getting a picture of how long people are waiting in Lightning Lanes when they redeem their Genie+ and Individual Lightning Lane (ILL) return times. And when we compare that to the standby waits at the same time, we can begin to see how much time people are saving by purchasing and using these services. So how much time can Genie+ or ILL save you at each attraction?
One thing to remember during this post is that this data isn’t representative of all times of day or all crowd levels – we’ve only been collecting this data for a little over a month. It’ll take a while to have more information, but we wanted to provide a peak into some data that could be helpful to you while we keep gathering!

Explain the Math!
In order to determine how much time you save by using the Lightning Lane for any particular attraction, we need to know two things:
- How long you waited in the Lightning Lane before experiencing the attraction
- How long you would have waited in the standby queue if you entered at the same time
In our case, the data for how long the Lightning Lane wait was is easy enough to find – we can get those directly from times waits in Lines 2.0. But determining the corresponding standby wait is where things get tricky. Unless we had another Lines user enter the standby line at the exact same moment, there has to be some calculation or assumption. The calculations and assumptions that I chose to use were:
- If an actual standby time was entered within 30 minutes (before or after) the Lightning Lane user entered the queue, I will use that standby time for comparison.
- If there is no nearby actual standby time, we will use the Touring Plans estimated wait at the time the user entered line as the best estimate of what the standby time would have been.
Once we’ve got those two numbers, the “Time Savings” will just be the Standby Wait minus the Lightning Lane wait.
How Much Time Will ILL Save Me At Each Attraction?

- Obviously time savings will shift based on time of day that the ILL return time takes place, and how crowded each day is. But this chart represents overall average time savings when we compare the Lightning Lane wait with what the standby wait would’ve been at the exact same time.
- Rise of the Resistance easily comes out on top with an average time savings of an hour and a half.
- Remy’s Ratatouille Adventure nabs second place because even with the virtual queue, the non-Lightning Lane queue has pretty regularly been remarkably backed up.
- Flight of Passage and Frozen Ever After ILLs will both save you over an hour compared to standby. Definitely not a bad deal. And Seven Dwarfs Mine Train is just behind with almost an hour of time savings.
- Things start to drop off after that point, with ILLs for Runaway Railway and Space Mountain only saving an average of about a half an hour. And unsurprisingly, Expedition Everest has the worst time savings of any ILL attraction.
How Does Time Savings Relate to Price Paid for ILL?
For ILLs, we can actually do a pretty fun and helpful calculation, because based on the day that the ILL was used, we know exactly how much someone paid for it and how much time they saved. We can therefore calculate how much you’re spending to skip each minute (or hour) in line.

- This chart shows the hourly cost of skipping the standby line at each ILL attraction. It’s split into weekdays and weekends because, so far, those are the only price fluctuations we’ve seen for ILL purchases. And we only had one data point for weekend Expedition Everest ILLs, so we’re not providing that calculation since it’s definitely not statistically representative.
- An interesting data point to keep in mind is that based on average ticket prices and park hours, an hour in the park could, on average, cost you about $15. That calculation is different for every party on each trip, but if we use it as a general cutoff, then we could figure out at what point an ILL purchase is “worth” its cost. If the hourly cost of the ILL is less than the hourly cost of your day in the park, you technically come out ahead.
- It turns out that taking price and time savings into consideration, the best bang for your buck is an ILL for Remy’s Ratatouille Adventure – no matter which day you use it.
- The next three best ILLs to buy are all on the weekend – Frozen Ever After, Rise of the Resistance and Flight of Passage. Frozen Ever After on weekdays is the only other ILL that costs less than $10 per hour of standby wait saved.
- If your cutoff of $15/hour is where ILLs are “worth it”, the only attractions that generally don’t qualify (or at least come really close to not qualifying) are Runaway Railway, Space Mountain, and Expedition Everest. I’ll be honest – Runaway Railway surprised me by appearing on that list.

- The above data is the exact same as the chart above, with the same conclusions, but presented in a slightly different way. This is the average number of minutes you will save for each dollar that you spend on an ILL reservation. Higher numbers are better because saving 10 minutes for your dollar is better than saving 2 minutes for your dollar.
How Much Time Can I Save At Each Genie+ Attraction?
A few things to remember about the data in this section. These are averages, and therefore don’t represent everyone’s experience. Time savings will vary based on time of day and crowd level. And they don’t represent all Genie+ eligible attractions. Attractions were only included on this list if we had at least five recorded Lightning Lane waits.
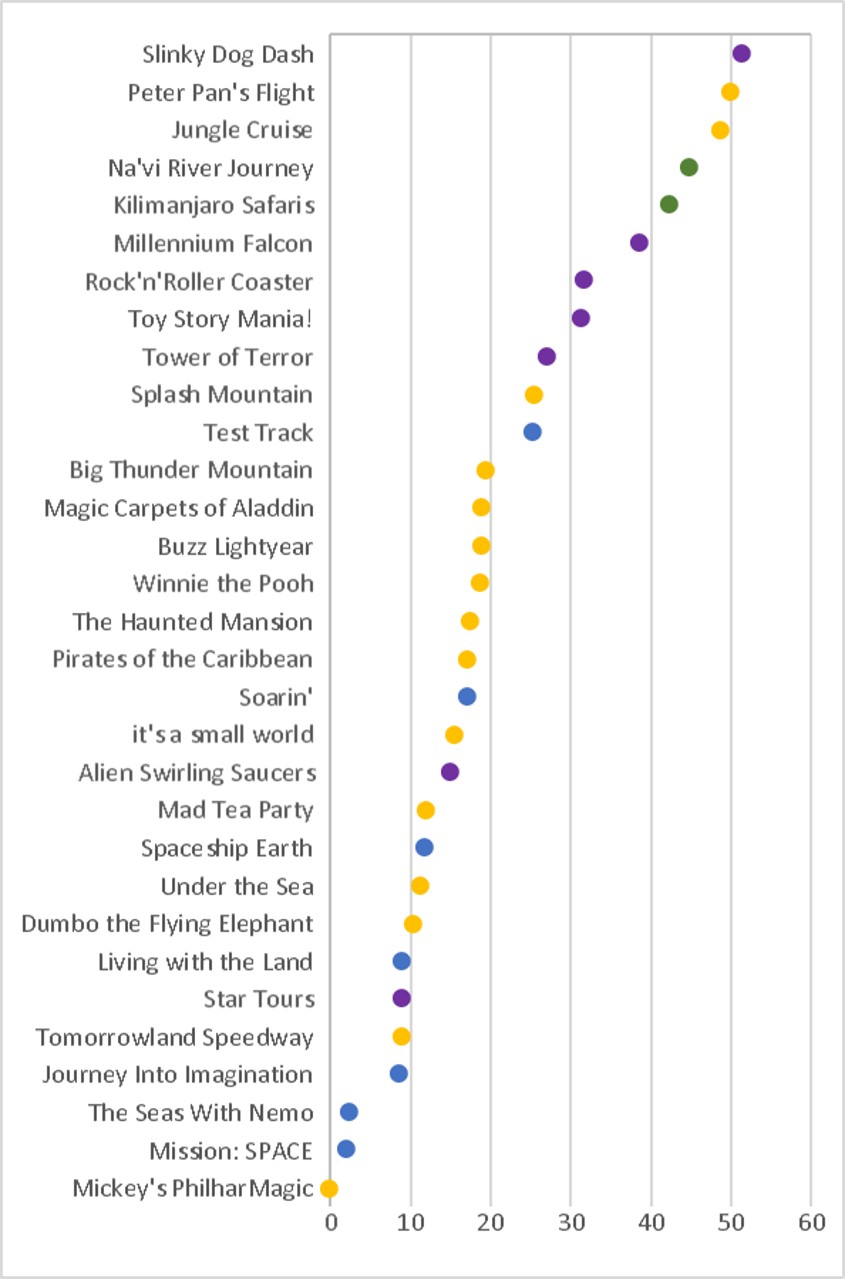
- Average time savings for Genie+ attractions range from 0 minutes (womp womp) to almost an hour – a time that competes with quite a few of the ILL attractions detailed above!
- The top tier of Genie+ attractions that regularly save more than 40 minutes of standby wait includes 5 options: Slinky Dog Dash (51.4 minutes), Peter Pan’s Flight (50.0 minutes), Jungle Cruise (48.7 minutes), Na’vi River Journey (44.8 minutes) and Kilimanjaro Safaris (42.3 minutes).
- The next tier of attractions includes six attractions that save Genie+ users between 20 and 40 minutes: Millennium Falcon: Smugglers Run (38.6 minutes), Rock’n’Roller Coaster (31.7 minutes), Toy Story Mania (31.3 minutes), Tower of Terror (27.0 minutes), Splash Mountain (25.6 minutes) and Test Track (25.3 minutes).
- There’s also a very obvious bottom tier of three attractions where Genie+ generally saves no time at all – The Seas With Nemo & Friends (2.3 minutes), Mission: SPACE (2.0 minutes) and Mickey’s PhilharMagic (0.0 minutes).
What Does This Tell Us About Genie+ At Each Park?
- At Magic Kingdom, if you want to maximize time savings by using Genie+, you’ll want to book Peter Pan’s Flight and Jungle Cruise – the two attractions that we know book up the fastest. Beyond that, almost all attractions have comparable time savings. So make your decisions based on what appeals to your touring party and what is available at a reasonable time. If Space Mountain were a Genie+ attraction (like it is during the crowded holiday season), it has comparable time savings to Splash Mountain.
- At Hollywood Studios, Slinky Dog Dash is the obvious time-saving winner of the bunch. But you can also get decent time savings by getting reservations for Millennium Falcon, Rock’n’Roller Coaster, Toy Story Mania and Tower of Terror. If Mickey and Minnie’s Runaway Railway were a Genie+ attraction (like it is during the holiday season), it fits in squarely with this second tier.
- At EPCOT, the attraction with the biggest time savings only saves about 25.8 minutes – which pales in comparison to the biggest time savings at every other park. That makes Frozen Ever After, if it’s eligible for Genie+ like it is during the holiday season, the very obvious first choice. Every other attraction has time savings of less than 20 minutes. EPCOT is easily the park with the lowest time savings per attraction overall.
- At Animal Kingdom, not enough people have timed their Lightning Lane wait on anything other than Na’vi River Journey or Kilimanjaro Safaris for us to be able calculate time savings. Both attractions, though show up in the highest tier of time savings. So if you are able to get and utilize both in one day, chances are you’ll save over 80 minutes on just those two attractions.
What Does This Mean For You?
- This data isn’t representative of every situation on every day. But it gives you some general guidance about where you can save the most time if you choose to purchase ILL or Genie+.
- If you want to prioritize ILL purchase based on bang for your buck, aim for Remy’s Ratatouille Adventure, Frozen Ever After, Rise of the Resistance, and Flight of Passage.
- Genie+ time savings are the worst overall at EPCOT, and the best at Hollywood Studios. Animal Kingdom just has too few worthwhile Genie+ attractions to choose from. Magic Kingdom has an abundance, so if you can use a lot of them you’ll be able to save a lot of time cumulatively.
Do any of the results for Genie+ or ILL time savings surprise you? Does the time savings data impact your decision whether or not to purchase? Let us know in the comments! And come back next week as we blend together availability and time savings data to calculate potential overall time savings per park, in various crowd conditions.

You May Also Like...
-

I'm pretty sure people have been commenting, emailing, and writing in to podcasts asking for this very content since ... December…
-

Last week, I posted our first analysis of Genie time savings and availability at Disneyland. Spoiler alert if you haven't read…
-

If you've been following along here .... at any point since October 2021, you know that we've covered a lot of…
-

Do you have a hankering to lie on a beach in a tropical paradise? Disney knows how to do vacation right,…
Becky – thank you so much for this data, article, and guest spot on the Disney Dish for this same topic. Please tell me: will you be reevaluating time saved per ride later in this year, and if so, will this same blog posting be updated with any different findings or should I keep my eyes out for future posts? I will be traveling with my family to Disney World in late August 2022 and was against the idea of purchasing Genie+ as our crowd levels are expected to be lower overall. Further, I figured if I did get Genie it would only be for some of the parks, but not a blanket purchase of all days. Between your post here and also your December 29 post on the subject, I am rethinking my opinion. Still, I do worry that the initial data used for these articles won’t be fully relevant by the time of my trip (due to whatever tweaks Disney will make by then + more users utilizing the system). Any future advice on these matters is highly appreciated.
I will absolutely be updating this information in future posts! With all of the data coming in from the holidays and January, we have a lot more to report on now. On Wednesday I’ll post about Genie+ availability throughout the day at different crowd levels, and then I’ll get back to updating attraction-specific information in the week or two following that.
Is there an article I should refer to with more updated info, or does this data still hold true? My family will be at wdw next month and I want to target the most time saving attractions.
I had a thought about a potential way to compare how Genie+ has affected standby lines compared to FP+ or pandemic times with regular lines only. Would it be possible to dig through the data Touring Plans has collected and start by pulling data for different rides that never had FP or Genie? You could then use those as a way to compare/contrast against rides that do use FP and now Genie.
IE, if there was a day in 2018 where the average wait time for Tea Cups was 1 hour, you could then find days in 2020 and now in 2022 where the average wait for Tea Cups was the same. It’s not perfect but now that you’ve established that the crowds were possibly at similar levels those 3 dates, you pull the data for the standby times on Big Thunder and you have a slight glimpse at how fast the standby line was moving. Obviously having more than 1 ride as your baseline would help make sure you were looking at similar crowd levels but if you could find days in different years where the wait times on Tea Cups, Magic Carpets, and Buzz Lightyear matched up, you might have a good chance of then looking at the FP/Genie rides and see the affect on the standby lines.
Terrific post and data as always 🙂 And some surprising results too. I wouldn’t have expected the potential time savings of Remy’s or Frozen, so that’s good to know. Will definitely impact my thinking for our upcoming trip.
Thanks, DL! EPCOT is certainly an interesting case. It’s absolutely the park where buying two ILLs makes the most potential impact. But it’s also the park where buying Genie+ makes the least potential impact. Very tricky.
Any idea when Touring Plans will be activating the ILL and Genie+ buttons in the personalized plans software?
Hey Dave – it should be around the second week of January. We had some re-coding to do when Disney changed the “get next” rules, and we don’t want to release new code over the next two weeks. But hte code looks good, and we’ll be able to suggest which G+ reservations to get next, too.
Do you have any data on whether there are more or less people using lightning lanes than for FP+? If it is less (which it probably is, given it is now a paid service), then I would have thought standby waits should be less. But I guess it depends upon whether they are still using the same ratios of lightning lane to standby lane as they used to with FP+. If it is still the same ratio they admit onto the ride, then standby wait times might well be higher, as there would be more people in that line than before.
I don’t think we can definitively tell that specifically from the data we collect, Marc. I too would guess that it is less than FP+.
Have you noticed an effect on stand by times because of lightning lanes?
That’s a tricky question to answer, statistically. So I won’t attempt it from that angle. We have to keep in mind that Genie+/ILL were introduced in a time where crowd patterns were already in flux, and we have no good “baseline” to compare to. Have standby times doubled since lightning lanes debuted? No. But they also certainly haven’t gotten shorter. Are they as long as they were in the FP era? Probably too soon to say. My gut says no, but my gut has been wrong plenty of times 🙂
These articles put me in numbers nerd-vana! Thank you!
Becky your articles are always so helpful! Thanks for the data points.
Thanks for the encouraging note, Jennifer!